
Published 15 Sep 2008
URL: http://www.kingcorn.org/news/articles.08/PKFert-0915.html
Dealing with High-Priced P and K Fertilizer
Jim Camberato & Brad Joern
Agronomy Dept., Purdue Univ.
West Lafayette, IN 47907-2054
Email address: jcambera
at purdue.edu & bjoern
at purdue.edu
The cost of phosphorus (P) and potassium (K) fertilizers have increased substantially resulting in heightened interest in the economical use of these nutrients. Fertilizer P and K applications should be based on the analysis of a representative soil sample. Using soil test results, P and K can be allocated to fields and portions of fields where crops are most likely to respond to fertilizer applications and omitted from areas where soil test P and K levels are already sufficient for supporting optimum crop yields. The judicious use of fertilizer P and K can help reduce the impact of high fertilizer prices.
Background information about P and K fertilizer recommendations
In Indiana, fertilizer P and K recommendations are largely driven by soil test P and K levels and use the build-up, maintenance and drawdown philosophy to interpret soil test P and K levels and make fertilizer rate recommendations (Figure 1). See the Tri-State Fertilizer Recommendations for more details on this approach (Vitosh et al., 1995).
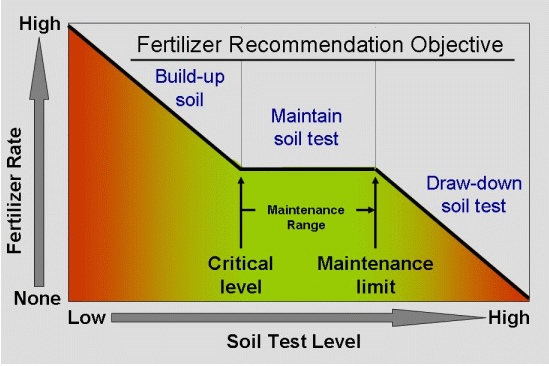
Fig. 1. An illustration of the philosophy behind the P and K recommendations
published in Vitosh
et al. (1995).
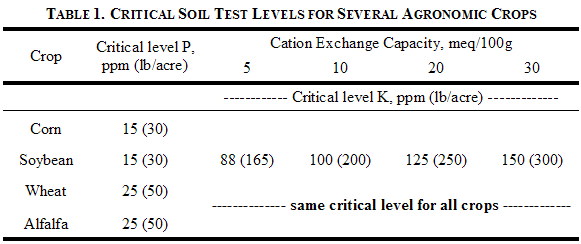
Below some soil test P and K level, there is a good chance of getting a yield response to nutrient additions. We refer to this soil test level as the “critical level”. The likelihood and magnitude of response to P or K applications increases as the soil test drops farther below the critical level. Critical soil test P and K levels for corn, soybean, wheat and alfalfa are listed in Table 1. The soil test P critical level is higher for wheat and alfalfa than it is for corn and soybean. The soil test K critical level changes with cation exchange capacity (CEC) but is the same for all crops. Fertilizer P and K recommendations are designed to optimize crop yield and build-up soil test levels to the critical level after four years of application when the initial P or K soil test is below the critical level.
Similarly, above some soil test P and K level, there is very little chance of getting a yield response to additional P or K. We refer to this soil test level as the “maintenance limit”. Between the critical level and the maintenance limit, regular P and K fertilizer additions are recommended at rates that will maintain soil test P and K levels. For P, the rate needed to maintain soil test P levels (maintenance rate) is equal to the P2O5 removed by each crop. For K, the maintenance rate is equal to crop K2O removal plus 20 lbs of K2O that may be leached or fixed by soils in a form not measured by traditional soil tests.
Above the maintenance limit a fraction of the maintenance rate is suggested to allow soil test levels to gradually fall back to the maintenance limit, even though soil test levels above the maintenance limit are not required to support optimum yield. At even higher soil test levels no fertilizer P and K is recommended. Fertilizer P recommendations go to zero at 40 ppm for corn and soybean, and 50 ppm for wheat and alfalfa. Fertilizer K recommendations go to zero at 138, 150, 175 and 200 ppm for soils with CECs of 5, 10, 20 and 30 meq/100g, respectively. If your soil test is reported in lb/acre the value can be converted to ppm by dividing by 2 (assuming an 8” sampling depth). For example: 80 lb/acre ) 2 = 40 ppm.
In fields with high P and K soil test levels, P and K fertilizer additions often can be eliminated for at least a couple of years to offset high P and K fertilizer prices. When soil test P and K levels fall below the maintenance limit, regular fertilizer additions are recommended to keep soil test P and K levels in the maintenance range and to keep nutrient levels sufficient for optimum yield.
How fast do soil test P and K levels drop if no fertilizer is applied?
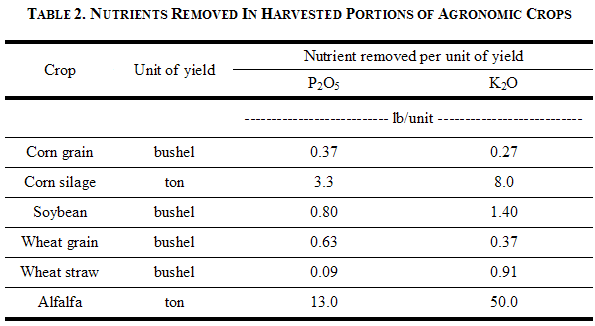
Soil test P and K levels decrease gradually in most soils when fertilization stops (the exception being very sandy soils). Soil test P levels decrease, on average, 1 ppm (2 lb/acre) for every 20 lb P2O5/acre removed by the crop. Changes in soil test K levels are dependent on CEC. High CEC soils change more slowly than low CEC soils. For example a soil with a CEC of 20 meq/100g would decrease 1 ppm (2 lb/acre) for about every 8 lb K2O/acre removed by the crop, while a soil with a CEC of 10 meq/100g would decrease 1 ppm (2 lb/acre) for every 6 lb K2O/acre, and a soil with a CEC of 5 meq/100g would decrease 1 ppm (2 lb/acre) for every 5 lb K2O/acre of crop removal. These estimates in soil test level changes, in conjunction with estimates of crop removal (Table 2), can be used to anticipate how quickly soil test P and K levels will decrease without fertilizer additions.
Example to show how to estimate decreases in soil test P and K levels
You have a field where you grow only corn and soybean and this field has a soil test P level of 45 ppm, a soil test K level of 200 ppm and a CEC of 10 meq/100g. The soil test levels are above the point of zero fertilizer recommendation for both P (40 ppm) and K (150 ppm), so no fertilizer P or K would be recommended for this field. You are hoping to average 200 bu/acre and 60 bu/acre, respectively (you can always hope…). What levels of soil test P and K are expected after two years of crop removal without fertilization?
Phosphorus removal and soil test P
From Table 2, each bushel of corn removes 0.37 lb P2O5/acre and each bushel of soybean removes 0.80 lb P2O5/acre. Therefore, a high yielding corn-soybean rotation (200 bu/acre corn and 60 bu/acre soybean) will remove about 120 lb P2O5/acre during this two year time period.
Corn P2O5 removal:
200 bu/acre-year x 0.37 lb P2O5/bu = 74 lb P2O5/acre
Soybean P2O5 removal: 60
bu/acre-year x 0.80 lb P2O5/bu = 48 lb P2O5/acre
Total lbs P2O5/acre removed
by corn and soybean crop = 122 lb P2O5/acre
If soil test P will decrease by 1 ppm for every 20 lbs P2O5/acre removed by a crop, then you would expect the soil test P in this field to decrease by about 6 ppm after two years of cropping without P fertilization.
122 lb P2O5/acre divided by 20 ppm P/lb P2O5 = 6.1 ppm P
Therefore, after 2 years of crop production, soil test P in this field will decrease from 45 ppm to approximately 39 ppm.
Potassium removal and soil test K
Similarly, from Table 2, each bushel of corn removes 0.27 lb K2O/acre and each bushel of soybean removes 1.40 lb K2O/acre. Therefore, a high yielding corn-soybean rotation (200 bu/acre corn and 60 bu/acre soybean) will remove about 180 lb K2O/acre during this two year time period.
Corn K2O removal: 200 bu/acre-year
x 0.27 lb K2O/bu + 20 lb K2O/year “loss” factor = 74
lb K2O/acre
Soybean K2O removal: 60 bu/acre-year
x 1.40 lb K2O/bu + 20 lb K2O/year “loss” factor = 104
lb K2O/acre
Total lbs K2O/acre removed by
corn and soybean crop = 178 lb K2O/acre
If soil test K will decrease by 1 ppm for every 6 lbs K2O/acre removed by a crop, then you would expect the soil test K in this field to decrease by about 30 ppm after two years of cropping without K fertilization.
178 lb K2O/acre divided by 6 ppm K/lb K2O = 29.7 ppm K
Therefore, after 2 years of crop production, soil test K will decrease from 200 ppm to approximately 170 ppm.
Bottom Line
Now is a great time to save on fertilizer costs if soil test levels are above the maintenance limit because fertilizer P and K are not needed to support optimum crop yields and will not need to be replaced by future fertilizer applications.
At soil test levels between the critical level and the maintenance limit fertilizer P and K are recommended to maintain soil test levels in a range that is sufficient to support optimum crop yields, but not more than enough. Not applying P and K fertilizer this season will not decrease crop yield but the decision is only economically beneficial if fertilizer prices fall in the short-term.
If soil test levels are below the critical level then crop yields are expected to be limited by soil P and K. The value of the lost yield is likely greater than the cost of fertilizer, especially considering the multiple year impact of the fertilizer application
Related References
Vitosh, M.L., J.W. Johnson, D.B. Mengel. 1995. Tri-state Fertilizer Recommendations for Corn, Soybeans, Wheat and Alfalfa (E-2567). Michigan State Univ, Ohio State Univ, and Purdue Univ Extension. [On-line]. Available at http://www.ces.purdue.edu/extmedia/AY/AY-9-32.pdf. [URL accessed 15 Sep 2008].
