June 2017
URL: http://www.kingcorn.org/news/timeless/AssessAvailableN.html
Soil Sampling to Assess Current Soil N Availability
Jim Camberato (jcambera@purdue.edu
and R.L. (Bob) Nielsen
(rnielsen@purdue.edu)
Agronomy Dept., Purdue Univ., West Lafayette, IN 47907-2054
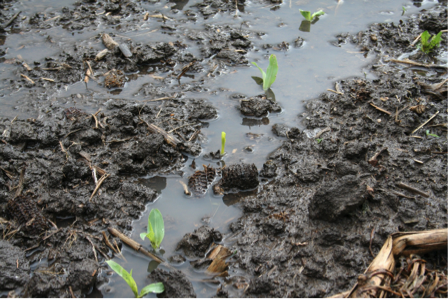
Excessive rainfall and flooding often result in the loss of applied and soil-derived nitrogen (N). Nitrate-N is the form of N most likely to be lost from the crop root zone, either to tile drainage and groundwater via leaching or into the atmosphere via denitrification. Ammonium-N is not vulnerable to the same losses when incorporated into the soil.
Most of the N applied to soil is initially in forms other than nitrate. The exception is liquid N (28-0-0 or 32-0-0), of which 25% of the fertilizer product is nitrate-N, the remainder is ammonium-N (25%) and urea-N (50%). Anhydrous ammonia is 100% ammonium-N when it reacts with water in the soil. Manure contains mostly organic- and ammonium-N forms.
Unfortunately, no matter what forms of N are added to the soil, all of them eventually convert to nitrate-N. Time, temperature, soil type, N source, rate, and application method, and other factors determine how rapidly nitrate-N is formed. It is difficult to estimate the extent of nitrate formation because of the many factors affecting N conversion and their interaction.
It is even more difficult to then estimate how much of the nitrate-N was subsequently lost from the root zone. Soil sampling and measuring the concentration of nitrate- and ammonium-N remaining in the root zone is an alternative to guesstimating how much N was lost.
Soil Sampling Strategies
Soil nitrate-N and ammonium-N are quite variable and so obtaining a good representative soil sample requires many cores from relatively small field areas. The depth of sampling recommended is 1 foot in most soils. Consider collecting a separate deeper soil sample from between 1- and 2-foot soil depth for a more complete assessment of plant available N, especially in sandy soils where leaching through the soil profile is the predominant form of N loss.
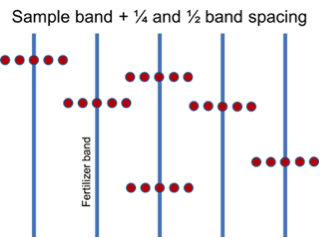
Where fertilizer N was broadcast-applied rather than banded, collect 20 to 30 random soil cores per sample. If fertilizer N was banded rather than broadcast-applied, collect 15 to 20 groups of 5 soil cores each that proportionally represent areas with and without banded fertilizer (see illustration to right).
Handling Soil Samples Prior to Delivery to Soil Test Laboratory
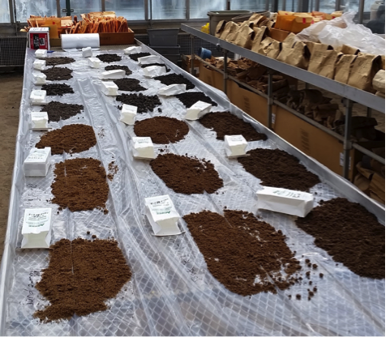
Dry or refrigerate the soil samples as soon as possible to stop the soil microbes from altering the N levels. Spread the soil thinly on plastic to air dry and hasten drying with a fan if possible. If you choose to use an oven to dry the soil, keep the temperature below 250 °F. Alternatively refrigerate the samples and keep them cold through shipping to the laboratory.
Most soil testing laboratories offer soil N test analysis services, but contact them first to confirm and ask about any special procedures they recommend.
Soil Test Laboratory Analyses
Ammonium-N is just as available to plants as nitrate-N, but typically little accumulates in the soil because it is readily converted to nitrate under most conditions. However, if N fertilizer was recently applied, there may well yet be some ammonium N available in the soil for plant use.
Significant levels of soil ammonium are most likely if anhydrous ammonia was the N source, a nitrification inhibitor such as nitrapyrin or dicyandiamide (DCD) was used, and/or soil pH was low (below 5.5 ). In these situations, low levels of soil nitrate may indicate little conversion of ammonium to nitrate, rather than simply loss of nitrate.
If soil test values for ammonium and nitrate are reported as "ppm" or "mg/L" nitrogen (NH4-N or NO3-N), then pounds per acre of available N are calculated by multiplying the test results by 4 when the sample depth was 1 foot. For other sample depths, divide the sample depth (in inches) by 3 and then multiply by the test results.
Example:
Soil NO3-N in a 1-foot sample was reported to be 30 ppm.
Conversion from ppm to pounds per acre
is (12 inches / 3) x 30 ppm = 120 pounds per acre.
If soil test values are reported directly as NH4 or NO3, then these values must be converted to an ‘N’ basis first. The calculations are: NH4-N = (NH4 / 1.2) and NO3-N = (NO3 / 4.5).
Example:
Soil NO3 was reported to be 90 ppm.
Conversion from NO3 to NO3-N is
(90 ppm NO3 / 4.5) = 20 ppm NO3-N.
Interpreting Soil Nitrate and Ammonium Levels
In our opinion, soil nitrate and ammonium levels can be used to guide additional N applications to fields subjected to saturation and flooding. However, there are admittedly no hard and fast research-based recommendations for this particular situation.
The primary tool for soil N sampling in the Eastern Corn Belt has been the pre-sidedress soil nitrate test (PSNT) which is most applicable as an indicator of N availability in soils where manure had been applied or a legume such as clover or alfalfa had been plowed down (Brouder & Mengel, 2003). For these field situations, the level of soil nitrate found is considered an index of N availability, i.e., an indicator of how much N is currently available AND how much N may become available from the manure or organic matter. When used in this context, soil NO3-N levels greater than 25 ppm are thought to be adequate for optimum corn yield without the addition of more fertilizer N.
During the research that developed this soil test, sampling deeper than 1 foot or analyzing for exchangeable NH4-N did not increase the predictive ability of the PSNT enough to warrant the extra effort. However, when the intent is to assess the loss of N due to rainfall, we suggest that deeper sampling plus analysis for NH4-N content can provide useful information to help growers decide whether additional fertilizer N is merited. It is important to recognize that in this context, measurements of soil nitrate and ammonium following fertilizer N applications indicate current N availability only, because there is no manure- or legume-derived N to be released later in the season. Considering this fact, the commonly accepted 25 ppm NO3-N critical level for manure- or legume-N fertilized soils may be too low for soils that have only received fertilizer N.
Leaching of soil nitrate is expected with ponding, flooding, or soil saturation, but not all of the nitrate will have been moved below the root zone. A shortcoming of the 1-foot sampling depth is that it does not always reflect plant available N deeper in the profile, particularly when abnormal leaching occurs. This is why we suggest also sampling from the 1- to 2-foot depth for assessment of soil N availability, particularly in sandy soils.
In our on-going N rate trials conducted throughout the state, the “normal” background levels of soil N in the upper 1 foot of mineral soils typically range from 5 to 10 ppm NO3-N and 4 to 8 ppm NH4-N for corn grown in rotation with soybean or corn without manure- or legume-derived N. Typically the deeper 1- to 2-foot soil samples would have slightly lower N levels.
Making a Decision
We suggest that the 25 ppm NO3-N critical level for manure- or legume-N fertilized soils may be too low for soils that have only received fertilizer N and where N loss conditions have been severe. Where enough rainfall has occurred to cause substantial N loss, we suggest this level of rain has depleted the lower soil profile as well as the upper foot of soil.
This table includes estimates of expected soil NO3-N levels with different fertilizer rates assuming “normal” background levels of nitrate and ammonium at the time of fertilization and a “normal” amount of movement below the one foot sampling depth (approximately 1/3 of the fertilizer N is moved below the 1-foot sampling depth but retained within the root zone with normal rainfall).
If the corn is healthy and the growing season is expected to be typical from here on out, we would suggest applying no more than 10 pounds of N for every 2 ppm reduction in soil sample N below the expected levels listed in the table.
Recognize that as a healthy crop moves through the rapid growth phase prior to pollination, soil N levels will naturally decrease in response to rapid N uptake by the plants. However, by the time a healthy crop reaches the V9 leaf stage (about 30 inches tall), only 19 lbs/ac N (equivalent to 5 ppm soil NO3-N in a 1-foot deep sample) have typically been taken up the plants (Mengel, 1995). But, by the time a healthy crop reaches shoulder-high (~V15 or 60 inches tall), approximately 116 lbs/ac N (equivalent to 29 ppm soil NO3-N in a 1-foot deep sample) have been taken up by the plants. With later corn the amount of N in the plant should be considered when evaluating soil N.
The following examples give you an idea of how the tabular information may be used to make this decision.
Example calculation when only NO3-N is determined:
Fertilizer N was applied at 160 pounds of N per acre in April as 28% UAN. Only soil NO3-N analysis was requested because it was assumed that most of the urea- and ammonium-N had been converted to nitrate since temperatures were warm prior to the excessive rainfall. The expected NO3-N level from the table above for a 160-lb N application is 35 ppm.
Laboratory results indicated only 20 ppm NO3-N. The suggested N application rate would be:
((35 ppm – 20 ppm) / 2) x 10 = (15 ppm / 2) x 10 = 7.5 x 10 = 75 pounds per acre
Example calculation when both NO3-N and NH4-N are determined:
Anhydrous ammonia was applied at 160 pounds of N per acre in March. Since the N application was relatively recent, both NO3-N and NH4-N analyses were requested. The expected NO3-N plus NH4-N levels listed in the table for a 160-lb N application is 41 ppm.
Laboratory results indicated 15 ppm NO3-N and 20 ppm NH4-N for a total measured N level of 35 ppm. The suggested N application rate would be:
((41 ppm – 35 ppm) / 2) x 10 = (6 ppm / 2) x 10 = 3 x 10 = 30 pounds per acre
Evaluating Your Decision
Loss of N due to excessive rainfall and response of corn stressed by excess water and N deficiency is difficult to predict. Unfortunately we frequently find ourselves in this same situation asking how much N is needed and what will be the yield increase. Although we have conducted some planned experiments that apply N to N stressed corn it is difficult to plan experiments to evaluate N application to N stressed corn caused by excess rainfall. But now we have another opportunity.
If you decide to apply additional N to corn, consider leaving 3 applicator-width strips without additional N through the length of the field to evaluate the response to the additional N. The strips should be distributed randomly across the field, not positioned side-by-side. Compare the yield of these unfertilized strips to adjacent fertilized strips to determine the change in yield and profit due to fertilization. Collecting this data will help in making future decisions related to N loss and potential profit from supplemental N fertilization. For assistance in planning an evaluation of supplemental N consult: Purdue On-Farm Nitrogen Rate Trial Protocol at http://www.agry.purdue.edu/ext/ofr/protocols/PurdueNTrialProtocol.pdf
Sidedress N Application Rates
If no fertilizer N has been applied this season or soil N measurements suggest little N remains from fall- and spring-applied N, consider using our current N rate guidelines based on results of field trials conducted since 2006 throughout the state and based on the use of efficient methods and timings of N fertilizer application. This information is summarized at http://www.kingcorn.org/news/timeless/NitrogenMgmt.pdf.
The average Agronomic Optimum N Rate (AONR) for corn/soy in 53 trials conducted on medium- and fine-textured soils in southwest, southcentral, southeast, and westcentral Indiana was 208 lbs N / ac. The average AONR for 30 trials conducted on medium- and fine-textured soils in northwest and northcentral Indiana was 212 lbs N / ac. The average AONR for trials conducted on medium- and fine-textured soils in other regions of the state were 232, 251, and 263 lbs N / ac for central (23 trials), eastcentral (26 trials), and northeast (11 trials) Indiana, respectively. The average AONR for 16 trials on nonirrigated sandy soils was 202 lbs N / ac. At five Purdue Ag. Centers where we conducted paired trials of corn following soybean (corn/soy) and corn following corn (corn/corn) from 2007 to 2010, the average AONR for corn/corn was 44 lbs greater than for corn/soy while average corn/corn yields were 18 bu / ac less than the corn/soy yields. Economic optimum N rates for various combinations of N cost and grain price can be obtained from the article referenced above or the Corn Nitrogen Rate Calculator [http://cnrc.agron.iastate.edu].
Related References
Blackmer, A.M., D. Pottker, M.E. Cerrato, and J. Webb. 1989. Correlations between soil nitrate concentrations in late spring and corn yields in Iowa. J. Prod. Agric. 2:103-109.
Brouder, Sylvie and David Mengel. 2003. The Presidedress Soil Nitrate Test for Improving N Management in Corn (AY-314-W). Purdue Extension. https://www.agry.purdue.edu/ext/pubs/AY-314-W.pdf. [URL accessed June 2017].
Camberato, Jim and RL (Bob) Nielsen. 2017. Nitrogen Management Guidelines for Indiana. Applied Crop Research Update, Purdue Univ. Agronomy Dept. http://www.kingcorn.org/news/timeless/NitrogenMgmt.pdf. [URL accessed June 2017].
Ferrer, F., J.M. Villar, C.O. Stockle, P. Villar, and M. Aran. 2003. Use of a pre-sidedress soil nitrate test (PSNT) to determine nitrogen fertilizer requirements for irrigated corn. Agronomie 23:561-570.
Mengel, David. 1995. Roots, Growth, and Nutrient Uptake (AGRY-95-08). Purdue Agronomy Extension. https://www.agry.purdue.edu/ext/pubs/AGRY-95-08.pdf. [URL accessed June 2017].
Nielsen, Bob. 2017. Purdue On-Farm Nitrogen Rate Trial Protocol. Purdue Agronomy Extension. https://www.agry.purdue.edu/ext/ofr/protocols/PurdueNTrialProtocol.pdf. [URL accessed June 2017].