Historical grain yields provide us with a glimpse of yields yet to come, although like the stock markets, past performance is no guarantee of the future. State average corn grain yield in Indiana has increased at a fairly constant 1.6 bushels per acre per year since 1930 primarily due to improved genetics and production technology (Fig. 1).
Since 1990, Indiana's corn crop yield has split even, with half of those years below trend and half above. The final USDA estimate for 2001 puts the 2001 Indiana corn crop at 156 bushels per acre, or 12.6 percent above the 2001 trend line yield. By comparison, other recent dramatic positive departures from trend yield were 1982 (16.5 %), 1987 (16.2 %), 1992 (18.4 %), 1994 (13.0 %) and 2000 (7.3 %). Corn production estimates for each crop reporting district in Indiana can be found in tabular (Nov '01 est's)or graphical (final est's)formats.
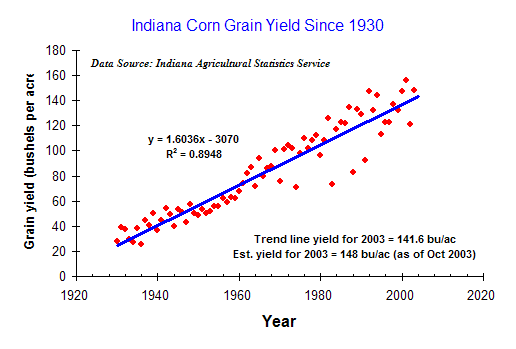
Fig. 1
While some point to the consistent 1.6 bu/ac/yr yield gain as a comforting signal that growers and researchers are continuing to be successful in their search for ever-increasing yields to feed the hungry world, others point out that the relative annual yield gain has been decreasing for years. Indeed, because the absolute annual yield gain has been relatively consistent, the relative annual yield gain for corn has been steadily decreasing (Fig. 2).
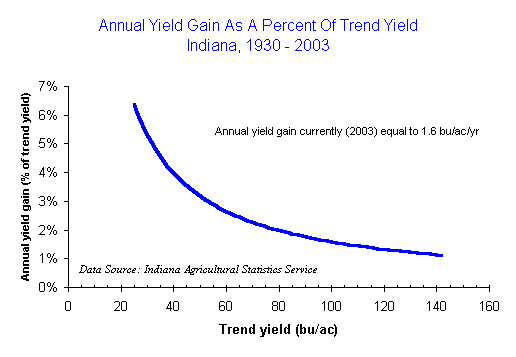
Fig. 2
Annual grain yield values fluctuate above and below the trend line throughout the nearly 70 year period of records, but four disaster years are especially noteworthy. Late planting plus early fall frosts in 1974 resulted in state average corn yields 25% less than the trend value. Severe droughts in 1983, 1988 and 1991 resulted in yields 33%, 29% and 25% less than trend values.
Because the departures from trend for these four years are so dramatic, it is of some interest to calculate the trend line for corn grain yield without their inclusion. In so doing, the annual rate of yield increase is slightly greater (1.7 versus 1.6 bu/ac/yr) and the estimated trend yield for 2001 changes from 138.6 to nearly 144 bushels per acre (Fig. 3). Such values may be more true estimates of statewide yield potential in "normal" years.
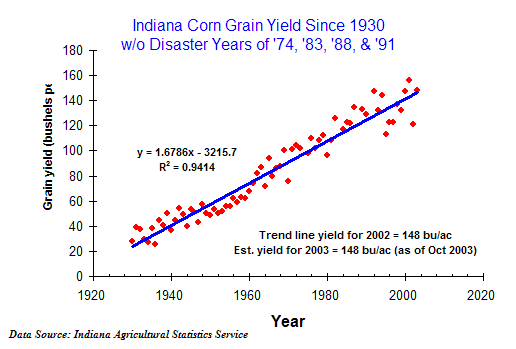
Fig. 3
The top five U.S. corn grain producing states are Iowa, Illinois, Nebraska, Indiana and Minnesota (Fig. 4). As of the January 2002 final production estimates, these five states (6.143 million bushels) accounted for nearly 65 % of the total estimated grain yield for the U.S. in 2001 (9.506 million bushels).
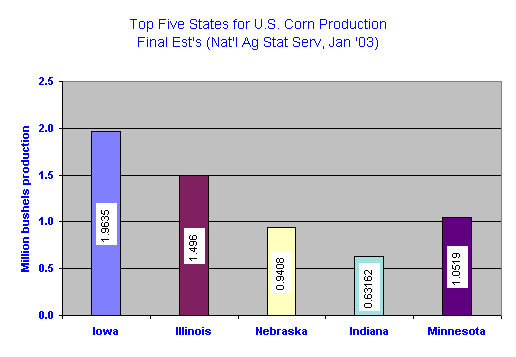
Fig. 4
Interestingly, the trophy for top statewide yields per acre does not belong to any of these Midwestern states. Bragging rights for highest U.S. corn yields per acre belong to states farther to the west (Fig. 5). A few reasons for this include a) fewer cloudy and hazy days, b) less rainfall and humidity contributing to less disease, c) availability of irrigation, and d) fewer stressful hot nights during grainfill.
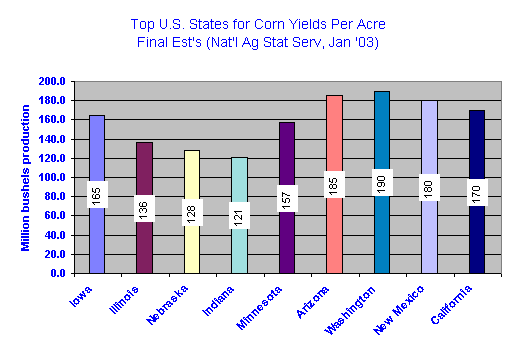
Fig. 5
For more statistics about Indiana agricultural production, "surf" on over to the home page of the Indiana Agricultural Statistics Service at http://www.nass.usda.gov/in/index.htm.
For more statistics on U.S. national crop production estimates, look at the National Agricultural Statistics Service Crop Production page on the Web.