
15 Aug 2013
URL: http://www.kingcorn.org/news/articles.13/CoolGrainFill-0815.html
Unseasonably Cool Weather: Good or Bad for Corn During Grain Fill?
R.L. (Bob) Nielsen
Agronomy Dept., Purdue Univ.
West Lafayette, IN 47907-2054
Email address: rnielsen
at purdue.edu
Recent early mornings with temperatures hovering in the upper 40's (F) and afternoon highs less than 80F are certainly not synonymous with those we typically experience during these "dog days of summer". While comfortably pleasant for us humans, there are those who question whether such unseasonably cool temperatures are good or bad for the corn crop as it progresses through the important grain filling period.
All things equal, cooler temperatures during grain fill typically result in heavier kernels and higher grain yield than do warmer temperatures, especially stressfully hot temperatures. Even though the rate of grain filling per day is slower when temperatures are cool, the duration of the grain filling period (number of days) is longer. The advantages of a lengthy grain fill period typically outweigh the disadvantages of a slower grain fill rate per day.
Record statewide corn yields in Indiana have generally occurred in years where average temperatures during July and August were cooler than normal. The greatest positive departures from trend yield since 1990 occurred in 1992 (+15.8%), 1994 (+10.4%), 2001 (+9.5%), 2004 (+13.7%), and 2009 (+9.3%). Four of those five growing seasons were characterized by average monthly temperatures for August ranging from 1.7 to 4.7 degrees F below normal.
Graybeards like myself consider 2004 to have been the nearly perfect growing season, in part due to the season-long moderate temperatures. Daily average temperatures across Indiana in July and August of that year were 2.1 and 3.4 degrees F below normal. Across the Midwest, July 2004 ranked as the 9th coldest and August as the 3rd coldest since 1895 (Midwest Climate Watch). In eastcentral Indiana (Farmland), half of the daily low temperatures recorded during July and August of 2004 were below 60F and four days dropped to 46F (Fig. 1). Statewide grain yield averaged 13.7% above the trend yield for that year and set a new record (up to that year) of 168 bu/ac.
So, what does this all mean for the current 2013 growing season? By comparison, as of mid-August, there have been 16 days since July 1 with daily low temperatures in the 50's and a couple down into the 40's at the same eastcentral Indiana reporting station (Fig. 2). Average daily temperatures across Indiana for the past 30 days have ranged from 1 to 3 degrees (F) below normal.
While it is true that some fields pollinated during the warm, muggy days of mid-July, most of the state's crop pollinated during much cooler temperatures (Fig. 1). While scattered reports have been received describing incomplete or scattered pollination problems, the bulk of the state's corn crop has pollinated well. Much of the state's crop has escaped severe stress during the crucial 1 to 2 weeks following pollination and so kernel survival has generally been quite good. Consequently, I believe the table is set for maximizing kernel numbers and ear weights in many fields.
Does this mean that we can expect another record-setting statewide average yield? Not necessarily so............................ Whoa! Why not?
We tend to forget about the excessive rainfall events that occurred throughout the state early in the season. Those rains prior to planting that provided such good opportunities to compact the soil with pre-plant field operations and with the planting operation itself. Those rains that resulted in large, drowned out areas in fields. Those rains that resulted in extended periods of soggy, saturated soils that took its toll on root development and health. Those rains that resulted in the loss of soil nitrate by leaching or denitrification. Consequently, many fields are not uniformly healthy. Stress from saturated soils during the ear size determination period may have compromised the top end ear size potential before pollination even occurred. Excessively cloudy weather during pollination may have reduced photosynthetic rates enough to interfere with the success of ovule fertilization and initial kernel development. In other words, in contrast to the record-setting year of 2004, the 2013 growing season has not been perfect.
I suspect that Indiana will end up with a solid overall average yield in spite of the early season stresses, in large part fueled by the favorable weather during pollination and grain fill. In essence, this is what USDA-NASS told us in their initial August yield estimate for Indiana. That being said, "it ain't over until it's over", meaning that the situation could still change.
By now, barely half of the state's crop has probably reached the dough stage of kernel development. At that stage, nearly half of the kernel dry weight is yet to be determined. Most fields have at least another 30 days of grain filling remaining before physiological maturity (kernel black layer) occurs. Some fields will require more than 30 days to reach physiological maturity. A lot could still happen, both favorable and unfavorable.
Many areas of the state have received less than normal rainfall for the past 30 days. The U.S. Drought Monitor does not currently (Aug 13) depict any areas of drought in Indiana, but compacted areas of fields, shallow-rooted crops, and crops in soils with naturally low water-holding capacity are in fact showing symptoms of drought stress. The current forecast for the remainder of the month is for above normal temperatures. Without meaningful amounts of rainfall, temperatures significantly above normal will cause similar stress in more fields around the state and interfere with the successful completion of the grain filling period.
Click image to view larger version.
Fig. 1. Historical air temperatures in eastcentral Indiana (Farmland) from May - Sept 2004.
Source of temperature graphic: Weatherspark.com. Annotations by RLNielsen.
Fig. 2. Historical air temperatures in eastcentral Indiana (Farmland) from May - Sept 2013.
Source of temperature graphic: Weatherspark.com. Annotations by RLNielsen.
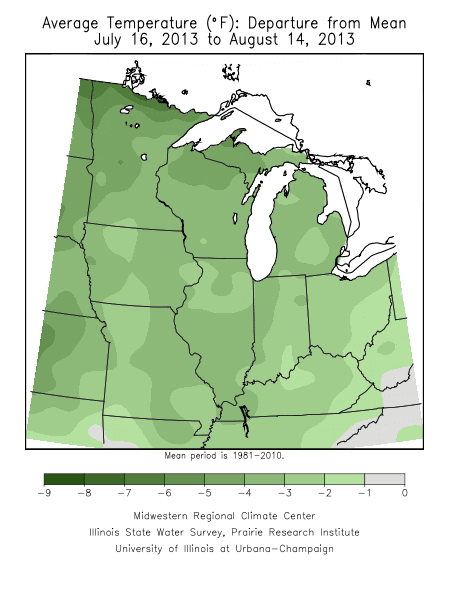
Fig. 3. Average temperature departure from mean from 7/16/13 to 8/14/13.
Graphic source: Midwest Climate Watch.
