Fig. 1.
Historical trends in grain yield and the prospect of using them to predict future grain yields are of interest to a wide range of folks involved with row crop agriculture, from farmers to global grain marketing specialists. Personally, I have always been mesmerized by the historical changes in national corn grain yield that USDA first began to publish in 1866 (Nielsen, 2023).
Changes in grain yield over time tend to be linear in nature, with the occasional change in the slope or rate of linear increase in response to changes in genetics or other agricultural technologies. Consequently, "trend lines" tend to be calculated using simple linear regression methodologies with widely available spreadsheet software like Microsoft Excel.
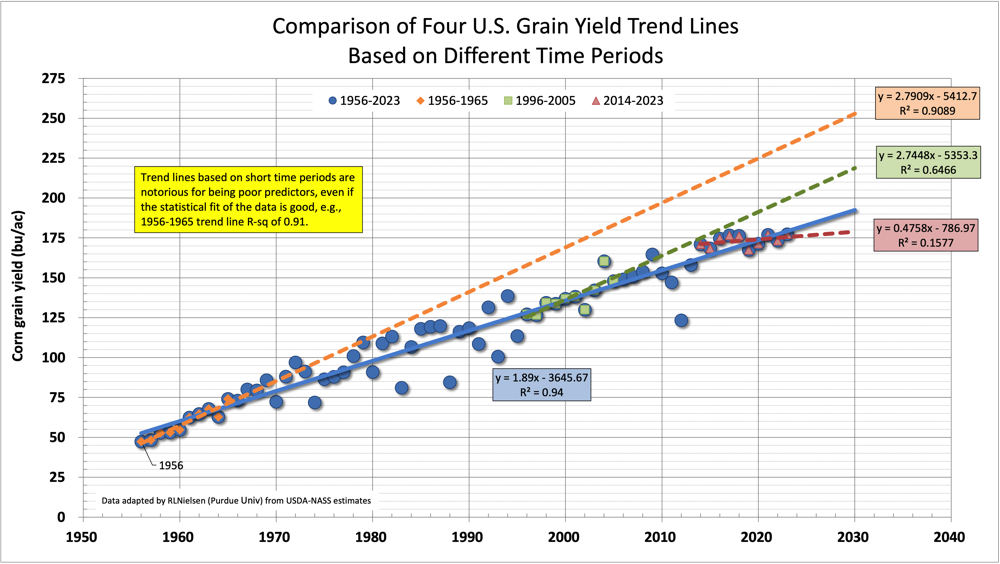
For example, the linear trend for corn grain yield improvement in the U.S. since 1956 has been 1.9 bu/ac/yr (Fig. 1, blue trend line). That trend line calculation accounts for 94% of the historical year-to-year variability in grain yields. In other words, that trend line is a very good "fit" to the data.
As with any use of statistics, there are certain precautions one should take to minimize the risk of drawing incorrect conclusions. One such precaution relative to grain yield trends is understanding the impact of the length of the time period used in estimating the yield trend line. Irwin and Hubbs (2020) addressed this issue from a somewhat different perspective. I want to illustrate the need for precautions using a few simple examples.
The 10-year period beginning with the 1956 U.S. corn crop was one in which grain yield increased over time fairly consistently. The linear yield trend calculated for that 10-year time period was a very good "fit" to the data (R2 = 0.91) and indicated that grain yield had increased at a rate of 2.8 bu/ac/yr (Fig. 1, orange trend line). There were undoubtedly agricultural "experts" in the spring of 1966 who confidently predicted that by the year 2030 the average U.S. national corn grain yield would be close to 250 bu/ac. History ultimately showed that those "experts" were wrong (Fig. 1). The growing conditions of the 10-year period 1956-1965 just happened to favor high grain yields.
The advent of hybrid corn with transgenic traits (so-called GMO or biotech hybrids) in the mid-1990s was loudly hailed as the precursor of the third "miracle" of corn yield improvement (e.g., Schill, 2007). Such proclamations were based, in part, on the simple belief in the power of biotechnology. Others later pointed to the 10-year trend line beginning in 1996 that seemingly showed that the historical trend in corn yield improvement (beginning in the mid-1950s) of 1.9 bu/ac/yr had, in fact, "miraculously" increased to 2.7 bu/ac/yr (Fig. 1, green trend line). That apparent increase in the linear rate of corn yield improvement predicted the average national corn grain yield by 2030 would be about 220 bu/ac.
(See my earlier article that references the previous historical "miracles" of corn yield improvement)
More recently, an article was published in the Agricultural & Applied Economics Association's Choices magazine (Boussios, 2024) which argues that the most recent 10 years of U.S. corn grain yield estimates from USDA indicate that U.S. corn productivity is beginning to slow down. While it is true that the trend line for U.S. grain yield for the past 10 years (2014-2023, Fig. 1, red trend line) describes a much lower annual rate of yield gain than the longer term trend line (Fig. 1, blue trend line) , I believe history shows that such short term trend lines do not necessarily predict future yields reliably.
I argue that there is no assurance that the trend line using the past 10 years (2014-2023) is any more predictive of future yields in 2030 than the one based on the earlier 10-year period (1956-1965). The trend line based on the past 68 years of historical yields has, to date, been a reliable predictor of future yield, interrupted by a number of years with unusually extreme growing conditions, and probably has a greater probability of being "in the ballpark" in the near future than any trend line based on much shorter time periods.
That's my opinion and you are entitled to it.
Boussios, David. 2024. A Slowdown in U.S. Crop Yield Growth. Choices, a publication of the Agricultural & Applied Economics Association. https://www.choicesmagazine.org/choices-magazine/submitted-articles/a-slowdown-in-us-crop-yield-growth [accessed Mar 2024].
Irwin, Scott and Todd Hubbs. 2020. "How Sensitive Are Trend Yield Projections for U.S. Corn to the Starting Year of the Estimation Period?"" farmdoc daily (10): 107, Department of Agricultural and Consumer Economics, University of Illinois at Urbana-Champaign. https://farmdocdaily.illinois.edu/2020/06/how-sensitive-are-trend-yield-projections-for-us-corn-to-the-starting-year-of-the-estimation-period.html [accessed Mar 2024].
Nielsen, RL (Bob). 2023. "Historical Corn Grain Yields in the U.S." Corny News Network, Agronomy Dept, Purdue Univ. https://www.agry.purdue.edu/ext/corn/news/timeless/YieldTrends.html [URL accessed Mar 2024].
Schill, Susanne Retka. 2007. "300-Bushel Corn is Coming." Ethanol Producer Magazine. BBI International. http://www.ethanolproducer.com/articles/3330/300-bushel-corn-is-coming/ [accessed Mar 2024].
Click image to view larger version in a popup window.
Fig. 1.