VI. SOIL EROSION AND COMPACTION
Soil Erosion by Water Next Section>>
Subsections: Splash erosion |
Sheet erosion | Rill erosion |
Gully erosion | Stream bank or channel erosion
Effects of erosion | Predicting soil loss by water erosion
The first step in the water erosion process is splash erosion. Raindrops strike the earth with considerable speed and energy. Some of the water infiltrates into and percolates through the soil, while some stays on or near the surface, saturating the soil and weakening natural soil aggregates. These weak aggregates are then broken down into smaller particles by the impact of subsequent raindrops. Erosion occurs as the dislodged soil particles travel with runoff water. To see the explosive dislodging effect of rain on soil, just look how high on a garden stake or building foundation soil material is splashed after a rain.
Splashing can start the movement of many tons of fertile topsoil down a slope and into streams and lakes. Therefore, limiting the breakdown of soil aggregates or keeping them in place is necessary to control erosion. Soil breakdown can be considerably reduced by: 1) keeping the soil covered with growing plants or plant residue, 2) maintaining strong soil aggregation of soil particles by adding organic matter to the soil, and 3) using sod-based rotations and good crop residue management practices.
back to topSheet Erosion
Sheet erosion occurs when rainfall runoff removes a thin layer of surface soil uniformly from an area. This is difficult to see because the water doesn’t cut any channels when carrying away soil particles.
Sheet erosion is more common on short slopes, where the speed and carrying capacity of the runoff water are not as great as on longer and/or steeper slopes. The major “symptom” of sheet erosion is a deposit of sediment at the base of a slope.
Continued failure to protect the soil from sheet erosion will eventually result in exposure of the subsoil. This means reduced productivity. If the exposed subsoil happens to be unfavorable for roots, productivity will be severely reduced.
back to topRill Erosion
Rill erosion develops when runoff water begins to cut definite channels or rills. Rills become wider and deeper as the velocity of runoff increases. Rill erosion is responsible for large amounts of soil loss and, thus, for serious reduction in productivity. Since the rills are only a few inches deep, they can be obliterated by normal tillage.
back to topGully Erosion
If erosion is not controlled, rills grow to gullies. A gully is large enough so that it cannot be masked by normal tillage operations and it interferes with the movement of farm implements. Tremendous losses of topsoil and subsoil can occur as gullies develop, resulting in severe productivity losses.
back to topStream Bank or Channel Erosion
Stream bank erosion normally begins along a permanent stream when flowing water undercuts the banks, causing soil material to fall into the channel. Where the stream curves, its outer banks are the most susceptible to erosion. Channel erosion occurs when the channel grade becomes steeper, thus causing the more rapidly flowing water to erode the channel bed.
back to topEffects of Erosion
If uncorrected, the erosion of farmland leads to productivity losses that eventually have economic consequences for everyone. Crop yields are reduced because of topsoil loss and fertility loss.
Topsoil Loss
Topsoil is a fragile “rind” on the earth’s surface that contains most of the nutrients needed for crop growth. Topsoil erosion takes away not only soil particles and organic matter, but also soil nutrients, resulting in reduced yield potential.
Where topsoil erosion has occurred, crops must be grown in the subsoil material, which normally has less total available moisture (perhaps the most critical requirement for crop growth). Mixing subsoil into the plow layer also makes it more susceptible to compaction, resulting in reduced plant rooting and poor stands.
Topsoil erosion also means loss of organic matter. This leads to poorer soil structure, causing the soil to crust easily, thereby reducing seedling emergence. It also reduces the rate at which water infiltrates into the soil and the storage of rainfall for crop growth.
Fertility Loss
Productivity losses are significantly related to fertility loss. Nutrients added to cropland over many years remain largely in the topsoil, whereas subsoil is much lower in nutrient content. For example, data from Purdue University’s Soil Characterization Laboratory showed that, in some soils, there may be 100 pounds of phosphorous per acre in the topsoil and 4 pounds or less in the subsoil.
Sedimentation
Much of the soil eroded from farmland becomes sediment pollution. Although erosion from urban areas also contributes to the sediment load in streams, cropland is by far the greatest contributor to sediment pollution because of the amount of land used for agriculture.
back to topPredicting Soil Loss by Water Erosion
Soil erosion cannot be eliminated entirely. Instead, the goal is to limit erosion to some level that will allow the soil to remain productive. This limit is called soil loss tolerance, T. Values of T are 2 tons/acre every year for shallow soils (< 20 in. deep), 2 or 3 tons/acre for moderately deep soils (20-40 in.), and 3 to 5 tons/acre for deep soils. The amount of erosion, A, can be calculated from environmental factors such as climate, soils, and landscape that we cannot do anything about, and management factors that we can control. The challenge of soil management is to select those management factors that will keep erosion rates less than T.
Universal Soil Loss Equation
From measurements of soil erosion over many years, scientists have developed an equation to predict soil loss by water, called the Universal Soil Loss Equation, USLE. The equation can be solved by anyone with a pocket calculator or a taste for pencil and paper multiplication. No complex mathematical operations are involved. The factors in the equation are simply numerical values that represent the physical processes leading to erosion. Some newer computer-based models are being developed in which the effects of the various factors that affect erosion are embedded in the computer code. The USLE, however, shows directly the effects of these factors, and so it is a good teaching tool. The USLE is:
| A = R x K x LS x C x P |
Where:
A stands for average annual soil loss (expressed in tons per acre).
R represents the potential of the rain in a particular area to produce erosion. In Indiana, it is lowest in the northeast and highest in the southwest (Fig. 54).
K represents erodibility (susceptibility to erosion) of a soil. The K factor can be estimated from soil texture and color as determined in soil evaluation (Table 9).
LS represents the combined effects of slope length (L) and steepness (S). Separate L and S numbers are entered in Table 10 to get the LS value.
L Erosion increases sharply as slope length increases. Slope length is the distance from the top of a hill to a drainageway or to the place where slope gradient changes enough that sediment is deposited. Typical slope lengths for representative Indiana soils are given in Table 11. For more accurate estimates of erosion, L can be measured in the field.
S Erosion also increases sharply as slope steepness or gradient (%) increases. It can be measured in the field or estimated from a soil survey.
C represents the type of tillage and cropping system used. If there is no land cover (a bare soil with no growing crop), C has a value of 1. On the other hand, C is almost zero (0.0005) under forest. Any growing crop or plant residue that covers the land during at least part of the year will reduce erosion. The C factor for the five tillage/cropping systems described in this manual, as well as some others, are given in Table 12. Some crop residue persists for more than one year on the surface of the soil. In preparing Table 12, we assumed that 25% of the corn residue at planting time lasts until the following planting time, but none of the soybean residue lasts that long. Thus, in a corn-soybean rotation with no-till, soybeans are planted in corn residue only, but corn is planted in soybean residue from the previous fall plus some corn residue from the fall before that. Notice that chisel tillage with 50% residue cover (C = 0.16, Table 12) is much more effective in controlling erosion than chisel tillage with little residue cover (C = 0.35).
P represents the reduction in erosion resulting from conservation practices that changes how water runs off the land, such as contouring, contour strip cropping, or terracing. The P factor is 1.0 when no special practices are used, and is 0.5 for contour tillage (Table 12).
The right side of the equation includes some factors that we cannot control, such as R, K, L, and S, and some that we can control, such as C and P. To use the equation we can calculate the value of R x K x LS and then determine the value of C x P (cropping and management practices) that will keep erosion, A, less than the tolerable limit, T. (Actually, the L factor can be controlled to some extent by terraces.) Some examples will illustrate the process.
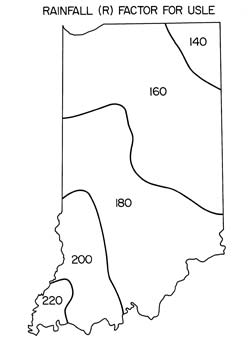
Fig 54. Map of Indiana showing rainfall intensity values
(R factor).
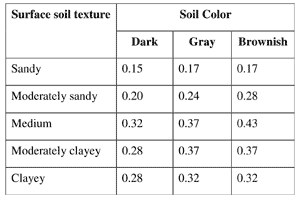
Table 9. Guidelines for estimating soil erodibility by water (K factor of the Universal Soil Loss Equation, USLE) from texture and color of the surface horizon.
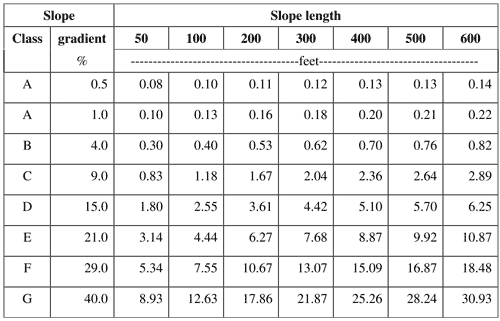
Table 10. Values of the topographic factor (LS of the USLE) for specific combinations of slope gradient and slope length.
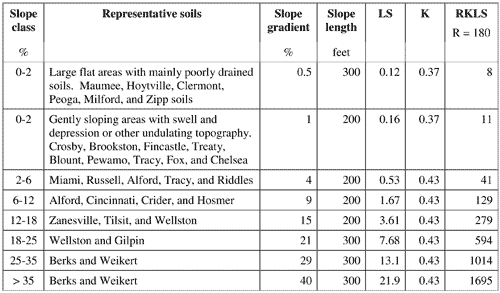
Table 11. Typical slope-length (LS) and erodibility (K) factors for some soil and slope conditions and calcuated RKLS values of the USLE.
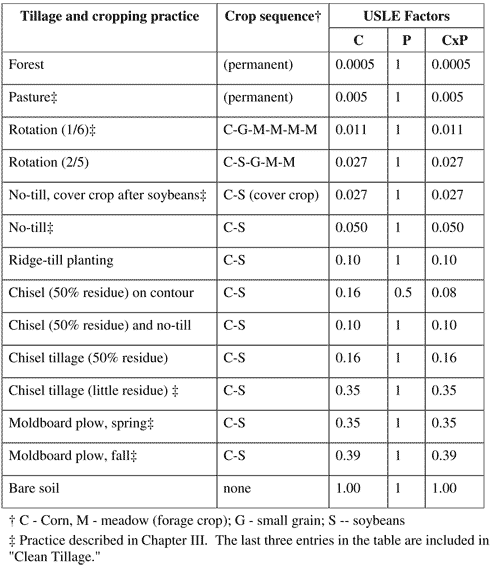
Table 12. Cropping and management (C) and conservation practice (P) factors of the USLE for several tillage/cover systems.
Example Calculations
Consider a Miami soil with a brownish silt loam surface horizon on a 4% slope in central Indiana. The land owner’s tillage sequence now consists of moldboard plowing in the fall with several shallow tillage operations in the spring, not on the contour. He plans to grow corn and soybeans in rotation. In central Indiana the R factor is 180 (Fig. 54). To find K, enter medium texture and brownish color in Table 9 to find a value of 0.43. If the farmer has specific slope length information, he should use it, but if he does not have it, he can use values from Table 11. These values were used for developing soil evaluation guidelines. In the example, slope length is 200 ft. From 4% and 200 ft., you can determine the LS value 0.53 in Table 10. The cropping and management factor (C) is 0.39, and the P factor is 1.0 from Table 12
A = R x K x LS x C x P
= 180 x 0.43 x 0.53 x 0.39 x 1.0
= 16
An erosion loss of 16 tons per acre is expected. This is much greater than the 3 to 5 ton annual loss (T) that is generally accepted as an allowable rate.
The farmer then questions which tillage and cropping systems could be used to control erosion to an annual loss of 4.5 tons per acre. Now the value for A is known but the value for C x P is to be determined.
A = R x K x LS x C x P
4.5 = 180 x 0.43 x 0.53 x C x P ,
which can be rearranged to:
C x P = (4.5) / (180x0.43x0.53)
C x P = 0.11
Thus any tillage/cover system that has a CP value of 0.11 or less is acceptable. Table 12 shows that forest, pasture, the sod-based rotations, no-till with or without a cover crop, ridge-till, chisel tillage on the contour, and chisel tillage with a cover crop after soybeans could adequately control erosion. Moldboard plowing and chisel tillage alone would not adequately control erosion. No-till with a cover crop after soybeans (CxP = 0.027, Table 12) results in a soil loss around 1.1 tons per acre:
A = 180 x 0.43 x 0.53 x 0.027
A = 1.1
This is less than 1/10 as much erosion as produced in his present operation. In another example, calculate the options a landowner has to limit erosion to less than 4 tons/acre on a Princeton fine sandy loam soil (brownish, moderately coarse surface) on 6% to 12% slope in southwestern Indiana:
A = 4
R = 220 (Fig 54.)
K = 0.28 (Table 9)
LS = 1.67 (Tables 10 and 11)
4 = 220 x 0.28 x 1.67 x CP
CP = (4) / (220x0.28x1.67)
CP = 0.063

Table 13. (Click for Larger Image) Annual erosion rates (A = RKLSCP) calculated using the USLE for various combinations of soil conditions and tillage/cover systems.
No-till alone, no-till with a cover crop, the sod-based rotations, pasture,
and forest are all suitable (Table 12). The amount of erosion expected
from representative soils and various combinations of slope and tillage/cover
systems is shown in Table 13.
back to top