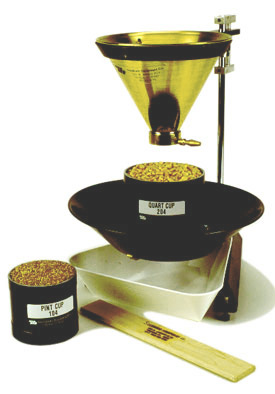
Fig. 1. A standard filling hopper and stand for the accurate
filling of quart or pint cups for grain test weight determination.
(Image: www.seedburo.com).
Fig. 2. Corn grain test weight versus grain yield for 27 hybrids
grown at 3 Kansas locations (Lingenfelser et al, 2011) . Click
on image to view larger version.
Fig. 3. Corn grain test weight versus grain yield for 22 hybrids
grown at Greenville, OH in 2012 (drought) and 2013 (ample
rainfall). Click on image to view larger version.
Updated September 2021
URL: http://www.kingcorn.org/news/timeless/TestWeight.html
Grain Test Weight Considerations for Corn
R.L. (Bob) Nielsen
Agronomy Dept., Purdue Univ.
West Lafayette, IN 47907-2054
Email address: rnielsen at purdue.edu
Twitter: @PurdueCornGuy
The official minimum allowable test weight in the U.S. for No. 1 yellow corn is 56 lbs/bu and for No. 2 yellow corn is 54 lbs/bu (USDA-AMS (FGIS), 1996). Corn grain in the U.S. is marketed on the basis of a 56-lb "bushel" regardless of test weight. Even though grain moisture is not part of the U.S. standards for corn, grain buyers pay on the basis of "dry" bushels (15 to 15.5% grain moisture content) or discount the market price to account for the drying expenses they expect to incur handling wetter corn grain.
Growers worry about low test weight because local grain buyers often discount their market bids for low test weight grain. In addition, growers are naturally disappointed when they deliver a 1000 bushel (volumetric bushels, that is) semi-load of grain that averages 52-lb test weight because they only get paid for 929 56-lb "market" bushels (52,000 lbs ÷ 56 lbs/bu) PLUS they receive a discounted price for the low test weight grain. On the other hand, high test weight grain makes growers feel good when they deliver a 1000 bushel semi-load of grain that averages 60 lb test weight because they will get paid for 1071 56-lb "market" bushels (60,000 lbs ÷ 56 lbs/bu).
These emotions encourage the belief that high test weight grain (lbs of dry matter per volumetric bushel) is associated with high grain yields (lbs. of dry matter per acre) and vice versa. However, there is little evidence in the research literature that grain test weight is strongly related to grain yield.
Hybrid variability exists for grain test weight, but does not automatically correspond to differences in genetic yield potential. Grain test weight for a given hybrid often varies from field to field or year to year, but does not automatically correspond to the overall yield level of an environment.
Similarly, grain from high yielding fields does not necessarily have higher test weight than that from lower yielding fields. In fact, test weight of grain harvested from severely stressed fields is occasionally higher than that of grain from non-stressed fields, as evidenced in Fig. 2 for 27 corn hybrids grown at 3 locations with widely varying yield levels in Kansas in 2011. Another example from Ohio with 22 hybrids grown in common in the drought year of 2012 and the much better yielding year of 2013 also indicated no relationship between yield level and grain test weight (Fig. 3).
Conventional dogma suggests that low test weight corn grain decreases the processing efficiency and quality of processed end-use products like corn starch (U.S. Grains Council, 2020), although the research literature does not consistently support this belief (Yang et al., 2000). Similarly, low test corn grain is often thought to be inferior for animal feed quality, although again the research literature does not support this belief (Laborie, 2019; Rusche, 2020; Simpson, 2000; Wiechenthal Pas et al., 1998). Whether or not low test weight grain is inferior to higher test weight grain may depend on the cause of the low test weight in the first place.
Common Causes of Low Grain Test Weight
The 2009 corn harvest season in Indiana (late crop maturation, late harvest) was an example of one where there were more reports of low test weight corn grain than good or above average test weights. There were primarily six factors that accounted for most of the low test weight grain in 2009 and four shared a common overarching effect.
Grain Moisture
First and foremost, growers should understand that test weight and grain moisture are inversely related. The higher the grain moisture, the lower the test weight AT THAT POINT IN TIME. As grain dries in the field or in the dryer, test weight naturally increases as long as kernel integrity remains intact. Test weight increases as grain dries partly because kernel volume tends to shrink with drying and so more kernels pack into a volume bushel and partly because drier grain is slicker which tends to encourage kernels to pack more tightly in a volume bushel. Therefore in a year like 2009 with many of the initial harvest reports of grain moisture ranging from 25 to 30% instead of the usual starting moisture levels of about 20 to 23%, it should not be surprising that test weights were lower than expected.
Hellevang (1995) offered a simple formula for estimating the increase in test weight with grain drying. In its simplest form, the equation is (A / B) x C; where A = 100 - dry moisture content, B = 100 - wet moisture content, and C = test weight at wet moisture content. The author does not say, but I suspect this simple formula is most applicable within a "normal" range of harvest moistures; up to moistures in the mid- to high 20's.
Example: Dry moisture = 15%, Wet moisture = 25%, Test weight at 25% = 52 lbs/bu.
Estimated test weight at 15% moisture = ((100 - 15) / (100 - 25)) x 52 = (85/75) x 52 = 58.9 lbs/bu
An older reference (Hall & Hill, 1974) offers an alternative suggestion for adjusting test weight for harvest moisture that also accounts for the level of kernel damage in the harvested grain (Table 1). The table values are based on the premise that kernel damage itself lowers test weight to begin with and that further drying of damaged grain results in less of an increase in test weight that what occurs in undamaged grain. Compared to the results from using Hellevang's simple formula, adjustments to test weight using these tabular values tend to result in smaller adjustments to test weight for high moisture grain at harvest, but larger adjustments for drier grain at harvest.
Stress During Grain Fill
Secondly, thirdly, and fourthly; drought stress, late-season foliar leaf diseases (primarily gray leaf spot and northern corn leaf blight), and below normal temperatures throughout September of 2009 all resulted in a significant deterioration of the crop's photosynthetic machinery beginning in early to mid-September that "pulled the rug out from beneath" the successful completion of the grain filling period in some fields; resulting in less than optimum starch deposition in the kernels. Fifthly, early October frost/freeze damage to late-developing, immature fields resulted in leaf or whole plant death that effectively put an end to the grain-filling process with the same negative effect on test weight.
Ear Rots
Finally, ear rots (diplodia, gibberella, etc.) were widespread throughout many areas of Indiana in 2009. Kernel damage by these fungal pathogens results in light-weight, chaffy grain that also results in low test weight diseased grain, broken kernels, and excessive levels of foreign material. This cause of low test weight grain obviously results in inferior (if not toxic) animal feed quality grain, unacceptable end-use processing consequences (ethanol yield, DDGS quality, starch yield and quality, etc.), and difficulties in storing the damaged grain without further deterioration.
Related reading
Bern, Carl and Thomas Brumm. 2009. Grain Test Weight Deception. Iowa State Extension Publication PMR-1005. https://lib.dr.iastate.edu/cgi/viewcontent.cgi?article=1035&context=abe_eng_pubs. [Accessed Sep 2021].
Bradley, Carl. 2009. Diplodia Ear Rot Causing Problems in Corn Across the State. The Bulletin, Univ of Illinois Extension. http://ipm.illinois.edu/bulletin/article.php?id=1233. [Accessed Sep 2021].
Hall, Glenn and Lowell Hill. 1974. Test Weight Adjustment Based on Moisture Content and Mechanical Damage of Corn Kernels. Trans. ASAE 17:578-579.
Hellevang, Kenneth. 1995. Grain Moisture Content Effects and Management. North Dakota State Extension Publication AE-905. http://www.ag.ndsu.edu/extension-aben/documents/ae905.pdf. [Accessed Sep 2021].
Hellevang, Kenneth. 2012. Grain Yield Not Related To Test Weight. Extension & Ag Research News, North Dakota State Univ. https://www.ag.ndsu.edu/news/newsreleases/2012/aug-20-2012/grain-yield-not-related-to-test-weight [accessed Sep 2021].
Hellevang, Kenneth. 2019. Many Factors Influence Corn Test Weight. North Dakota State Univ. Extension. https://www.ag.ndsu.edu/news/newsreleases/2019/nov-25-2019/many-factors-influence-corn-test-weight [Accessed Sep 2021]
Hicks, D.R. and H.A. Cloud. 1991. Calculating Grain Weight Shrinkage in Corn Due to Mechanical Drying. Purdue Extension Publication NCH-61 http://www.ces.purdue.edu/extmedia/nch/nch-61.html [Accessed Sep 2021].
Hill, Lowell D. 1990. Grain Grades and Standards: Historical Issues Shaping the Future. Univ. of Illinois Press, Champaign, IL.
Hurburgh, Charles and Roger Elmore. 2008. Corn Quality Issues in 2008 - Moisture and Test Weight. Integrated Crop Management News, Iowa State Univ. Extension. https://crops.extension.iastate.edu/cropnews/2008/10/corn-quality-issues-2008-moisture-and-test-weight. [Accessed Sep 2021].
Hurburgh, Charles and Roger Elmore. 2008. Corn Quality Issues in 2008 – Storage Management. Integrated Crop Management News, Iowa State Univ. Extension. https://crops.extension.iastate.edu/cropnews/2008/10/corn-quality-issues-2008-�-storage-management. [Accessed Sep 2021].
Laborie, Erin. 2019. Feeding Light Test Weight Corn in Growing and Finishing Diets. Univ. of Nebraska Extension. https://beef.unl.edu/beefwatch/feeding-light-test-weight-corn-growing-and-finishing-diets [Accessed Sep 2021]
Lingenfelser, Jane (sr. author). 2011. Kansas Crop Performance Tests with Corn Hybrids (SRP1055). Kansas State University Agricultural Experiment Station and Cooperative Extension Service, Kansas State Univ.
Nafziger, Emerson. 2003. Test Weight and Yield: A Connection? The Bulletin, Univ of Illinois Extension. http://ipm.illinois.edu/bulletin/pastpest/articles/200323h.html. [Accessed Sep 2021].
Rankin, Mike. 2009. Understanding Corn Test Weight. Univ Wisconsin Extension. https://fyi.uwex.edu/grain/files/2009/12/CornTW09.pdf. [Accessed Sep 2021]
Rusche, Warren. 2020. Feeding Value of Light-Test Weight Corn. iGrow, South Dakota State Univ Extension. https://extension.sdstate.edu/feeding-value-light-test-weight-corn [Accessed Sep 2021]
Simpson, Greg. 2000. Summary of Research on Feeding Low Test Weight Corn to Pigs. Ontario Ministry of Ag, Food, and Rural Affairs. http://www.omafra.gov.on.ca/english/livestock/swine/facts/info_n_summary.htm [Accessed Sep 2021]
USDA-AMS (FGIS). Sep 1996. Subpart D of U.S. Standards for Corn. U.S. Standards. U.S. Department of Agriculture - Agricultural Marketing Service (Federal Grain Inspection Service). https://www.ams.usda.gov/sites/default/files/media/CornStandards.pdf. [Accessed Sep 2021].
USDA-AMS (FGIS). Oct 2020. Grain Inspection Handbook, Book II: Grain Grading Procedures. United States Department of Agriculture - Agricultural Marketing Service (Federal Grain Inspection Service). https://www.ams.usda.gov/sites/default/files/media/Book2.pdf [Accessed Sep 2021]
USDA-AMS (FGIS). [date unknown]. Test Weight per Bushel. in Corn Grading Tutorial. United States Department of Agriculture - Agricultural Marketing Service (Federal Grain Inspection Service). https://apps.ams.usda.gov/elearning/Grading/Grading_Corn/presentation_html5.html. [Accessed Sep 2021].
U.S. Grains Council. 2020. Test Weight. in Corn Export Cargo Quality Report 2019/2020. U.S. Grains Council. https://grains.org/corn_report/corn-harvest-quality-report-2019-2020/4/ [Accessed Sep 2021]
Weichenthal Pas, B.A., I.G. Rush, B.G. Van Pelt, A.D. Howes, and J.R. Males. 1998. Light-Test Weight Corn for Growing and Finishing Steers. The Professional Animal Scientist, Vol. 14, Issue 2, pp. 114-117. Elsevier, Inc. http://www.sciencedirect.com/science/article/pii/S1080744615318040 [Accessed Sep 2021]
Woloshuk, Charles and Kiersten Wise. 2009. Diplodia Ear Rot. Purdue Extension Publication #BP-75-W. https://www.extension.purdue.edu/extmedia/BP/BP-75-W.pdf. [Accessed Sep 2021].
Yang, P., R. J. Shunk, A. E. Haken, Y. X. Niu, S. H. Zou, P. Buriak, S. R. Eckhoff, M. E. Tumbleson. 2000. Yield, Protein Content, and Viscosity of Starch from Wet-Milled Corn Hybrids as Influenced by Environmentally Induced Changes in Test Weight. Cereal Chemistry 77 (1):44-47. https://onlinelibrary.wiley.com/doi/epdf/10.1094/CCHEM.2000.77.1.44 [Accessed Sep 2021].