| Plate 1. Miami-Crosby-Brookston landscape in central Indiana . The dark areas are Brookston soils in depressions; the light areas are Crosby soils on swells and uneroded Miami soils; and the reddish-brown areas are eroded Miami soils on hillslopes. | 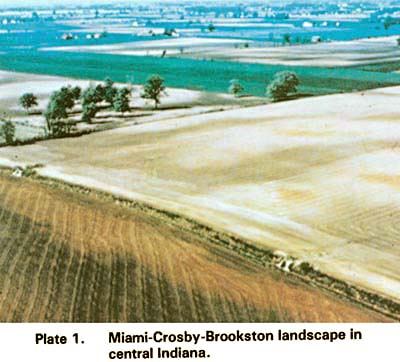 (Click for larger) |
| Plate 2. Miami silt loam. This soil, developed under forest vegetation, has never been plowed. It has an E horizon with platy structure below the dark A horizon. Note the clay films on the faces of the peds around 3 feet deep in the part of the profile that shows natural structure. The C horizon is glacial till. The scale is decimeters (C) and feet (F). | 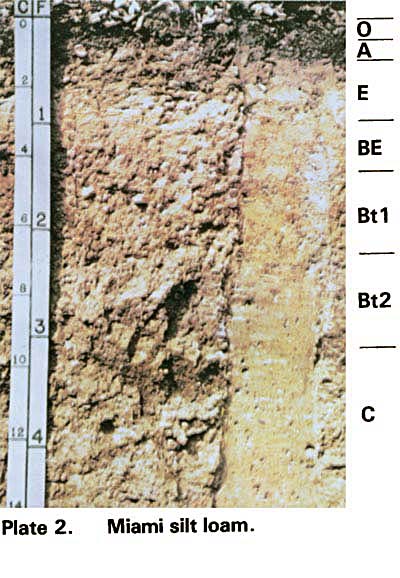 (Click for larger) |
| Plate 3. Crosby silt loam. On the left side, the soil has been picked with a knife to show soil structure. That on the right has been cut with a spade. The darker color on the left side of the Bt horizon is caused by coatings on natural ped surfaces. On the right side, a small part of the original E horizon remains. The rest of the E is mixed in the A horizon. At about 4 feed deep in the glacial till C horizon, note the glacial cobbles and gravel on the left and the light-colored streaks on the right. The scale is decimeters and feet. | 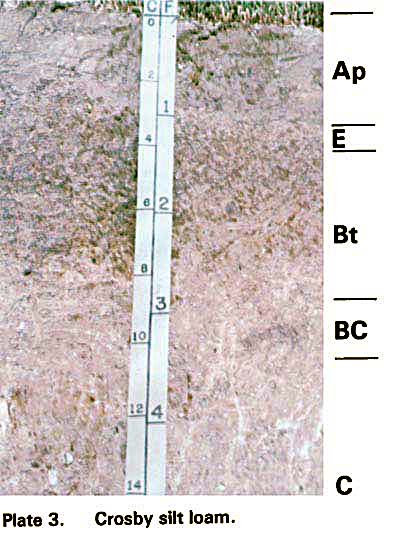 (Click for larger) |
| Plate 4. Brookston silty clay loam. The plow layer (Ap horizon) is not quite as dark as the A horizon below it. This may be because some light-colored Ap material was eroded from the adjacent Crosby soils, deposited on the Brookston surface, and then mixed by tillage. The cut part of the profile (right) shows the interior of soil peds. The left part, picked to reveal soil structure, shows the ped coatings, which are mainly on vertical ped surfaces. The scale is decimeters and feet. | 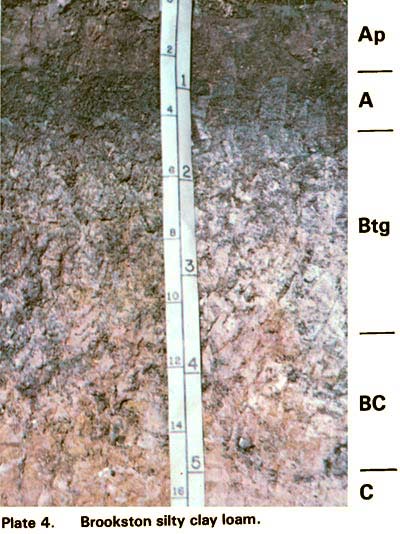 (Click for larger) |
| Plate 5. Parr loam. This soil formed under prairie vegetation. Its other factors of soil formation are similar to the Miami soil. The scale is decimeters and feet. | 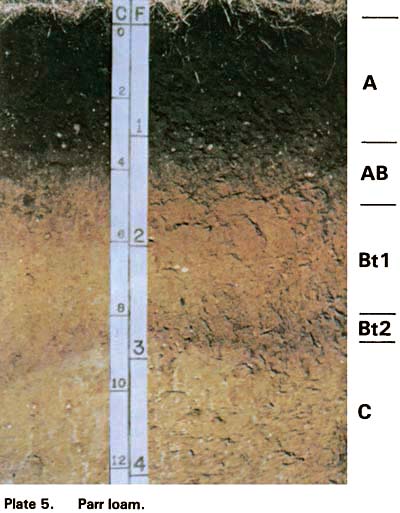 (Click for larger) |
| Plate 6. Ockley silt loam. This soil formed from loess and loamy outwash over sand and gravel outwash deposits. The lower boundary of the Bt3 horizon is very irregular, with 'tongues' of Bt3 material extending into the C horizon. The dark color of the Bt3 horizon is caused by the deposition of clay and organic matter leached from the horizons higher in the profiles. The scale is decimeters and feet. | 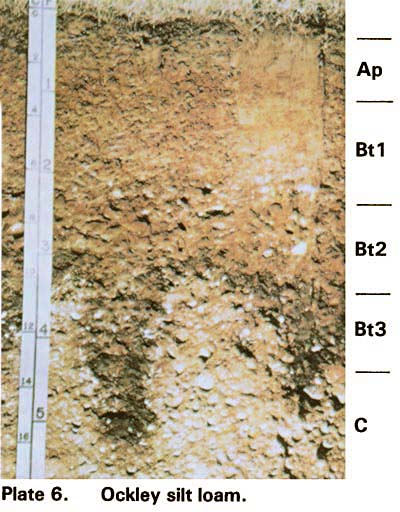 (Click for larger) |
| Plate 7. Chelsea fine sand. This soil formed in sand dunes. Below 4 feet are thin bands that have slightly more clay content than the material between them. These bands are the Bt part of the horizon, and the material between them is the E part. | 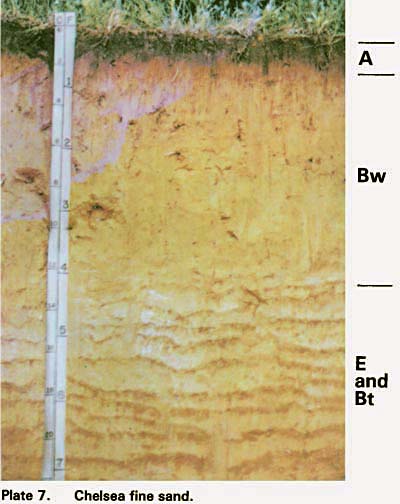 (Click for larger) |
| Plate 8. Genesse loam. This soil formed by alternate deposition of dark-colored oil material high in organic matter and light-colored material low in organic matter. Both types of material were carried in by flood water. The bands of different color are more pronounced in this particular soil than in most flood plain soils. The scale is decimeters and feet. | 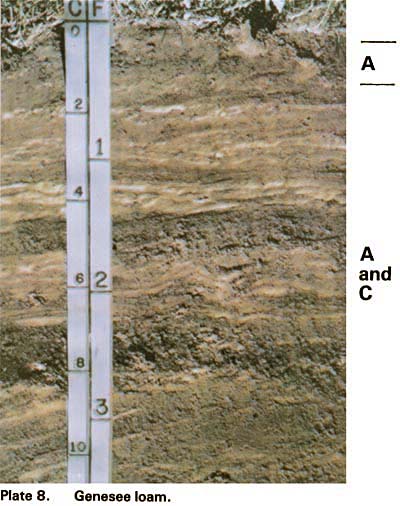 (Click for larger) |
| Plate 9. Caneyville silty clay loam, eroded. This profile illustrates a soil with limestone bedrock at about 3 feet deep. The reddish color in the Bt horizon is typical of soils over limestone. The scale is decimeters and feet. | 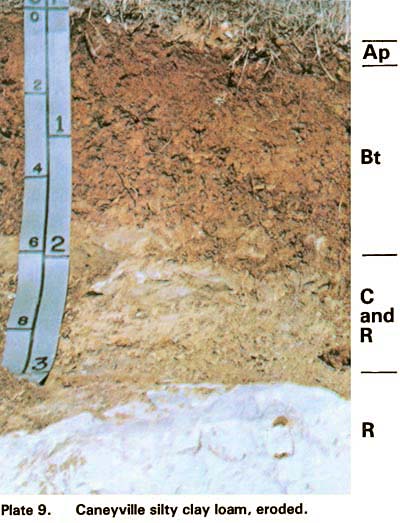 (Click for larger) |
| Plate 10. Trappist silt loam. The Trappist soil formed from loess and weathered black shale. The BC horizon still shows the layered structure of the shale, but it is soft enough to cut with a knife or spade, and roots are growing in it. Below 33 inches, the rock is harder and roots do not penetrate it, making that the limiting layer. The scale is decimeters and feet. | 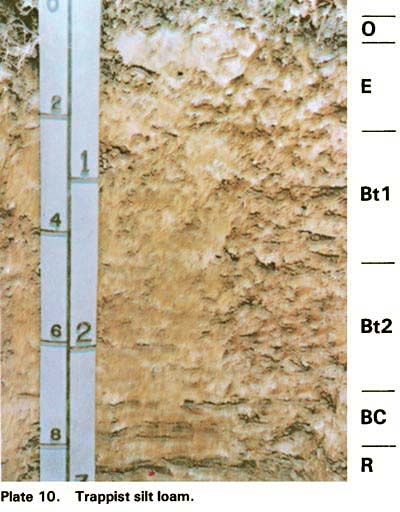 (Click for larger) |
| Plate 11. Alford slit loam. This Alford profile formed in deep loess deposits. It has no restricting layers and holds much water for utilization by plants. The scale is feet. |  (Click for larger) |
| Plate 12. Hosmer silt loam. This soil has a fragipan between 3 and 5 ½ feet. The nearly-white colors on the left side of the Bx horizon and in the lower right corner of the photograph are from silt coatings on the faces of prisms. The whitish vertical streaks in the cut surface are from prism faces at right angles to the surface. A top view of these coatings is shown in Plate 16. the scale is decimeters and feet. | (Click for larger) |
| Plate 13. Crosby upper Bt horizon, silt coatings. The whitish coatings on the ped surfaces are mainly silty. They were relatively dry when the photograph was taken, thus appear powdery. The scale is centimeters. | 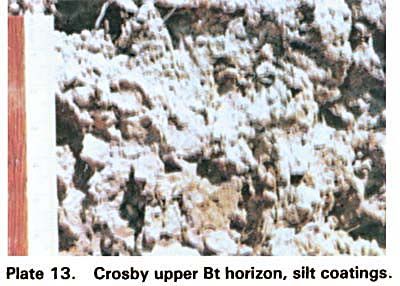 (Click for larger) |
| Plate 14. Mottling of gray and brownish colors. These two colors are about equally represented in this photograph. The gray colors indicate restricted soil drainage. The scale is inches and centimeters. | 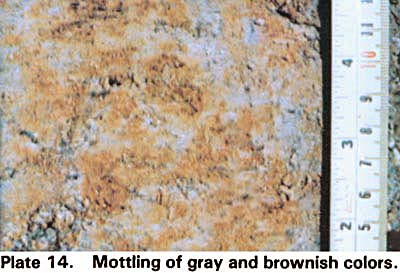 (Click for larger) |
| Plate 15. Crosby lower Bt horizon. This is the lower part of the Bt horizon of the same soil represented in Plate 13. The left side shows clay coatings on ped surfaces. The right side is a cut surface showing mottling inside peds and some smeared clay ped coatings. The scale is centimeters. | 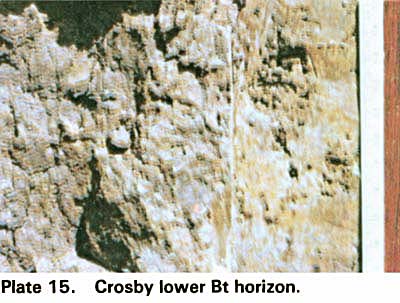 (Click for larger) |
| Plate 16. Horizontal section through a fragipan in Zanesville soil. The gray streaks form a pattern like chicken wire or a honeycomb, but with more irregular pattern. Plate 12 is a side view of the ped coatings that form these streaks. The knife is about 10 inches long. | 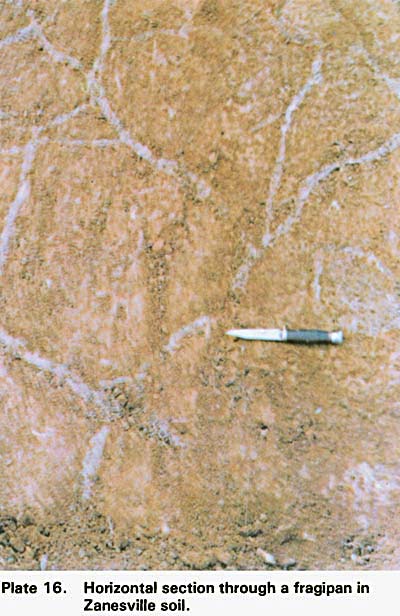 (Click for larger) |