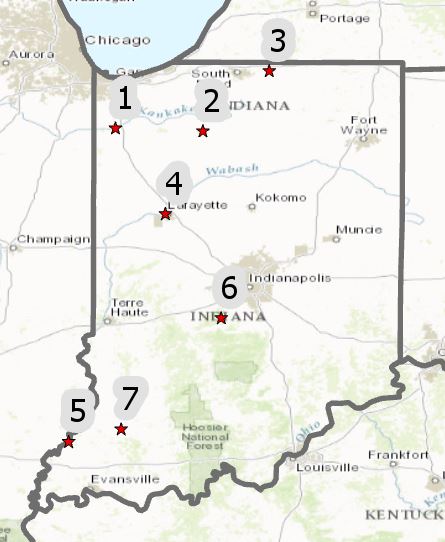
All rivers included in this analysis started the year at or above long-term average flow rates. Dry conditions in January resulted in discharge statewide falling below the long-term average from late January into early February. Between February and June river discharge was generally at or above the long-term mean. Northern river [1,2,3,4] discharge dipped in early May and again in early June, falling below the long-term average for all but the St. Joseph River [3]. River discharge for all rivers dipped well below average in late June into July when the state was starting to experience drought conditions.
Moderate drought conditions affected 44% of the state by the week of July 12th, according to the U.S. Drought Monitor. Increased precipitation and lower temperatures reduced the extent of drought in late July and August, which resulted in higher streamflow. The Wabash River [4,5] and White River [6] finished the water year with below normal discharge rates, while the other four rivers were at or just above their long-term average discharge rates. Surface water available in state rivers ended the year at or below normal.
Source: USGS Surface Water