Climate is a powerful driver of agricultural and natural systems, and spatial climate data sets in digital form are currently in great demand. This is especially true in the Arequipa Region of Peru, a region with low seasonal precipitation, significant topographic variability, and high demand for water use in highly managed water systems. To better understand meteorological and climate changes in Arequipa, the SWM team created a dataset that contains 30 years of annual, monthly and daily gridded climate maps of precipitation and maximum and minimum air temperature from January 1, 1988, to December 31, 2017. It was created using weather station data from the Servicio Nacional de Meteorología e Hidrología del Perú (SENAMHI) and the National Ocean and Atmospheric Administration’s (NOAA) Global Summary of the Day (GSOD). Topography data, used as covariates for spatial interpolation, came from the ALOS World 3D DEM. Weather data went through extensive preprocessing for removal of implausible values, data gap filling, and inhomogeneity detection. Maps were created using a Regression Thin-Plate Splines (RTPS) method that made use of Polynomial and Potential Regression Models specifically developed for the region. Please see our Publications page for more information about articles related to this work. There are data publications both for climate normals and yearly, monthly, and daily maps.
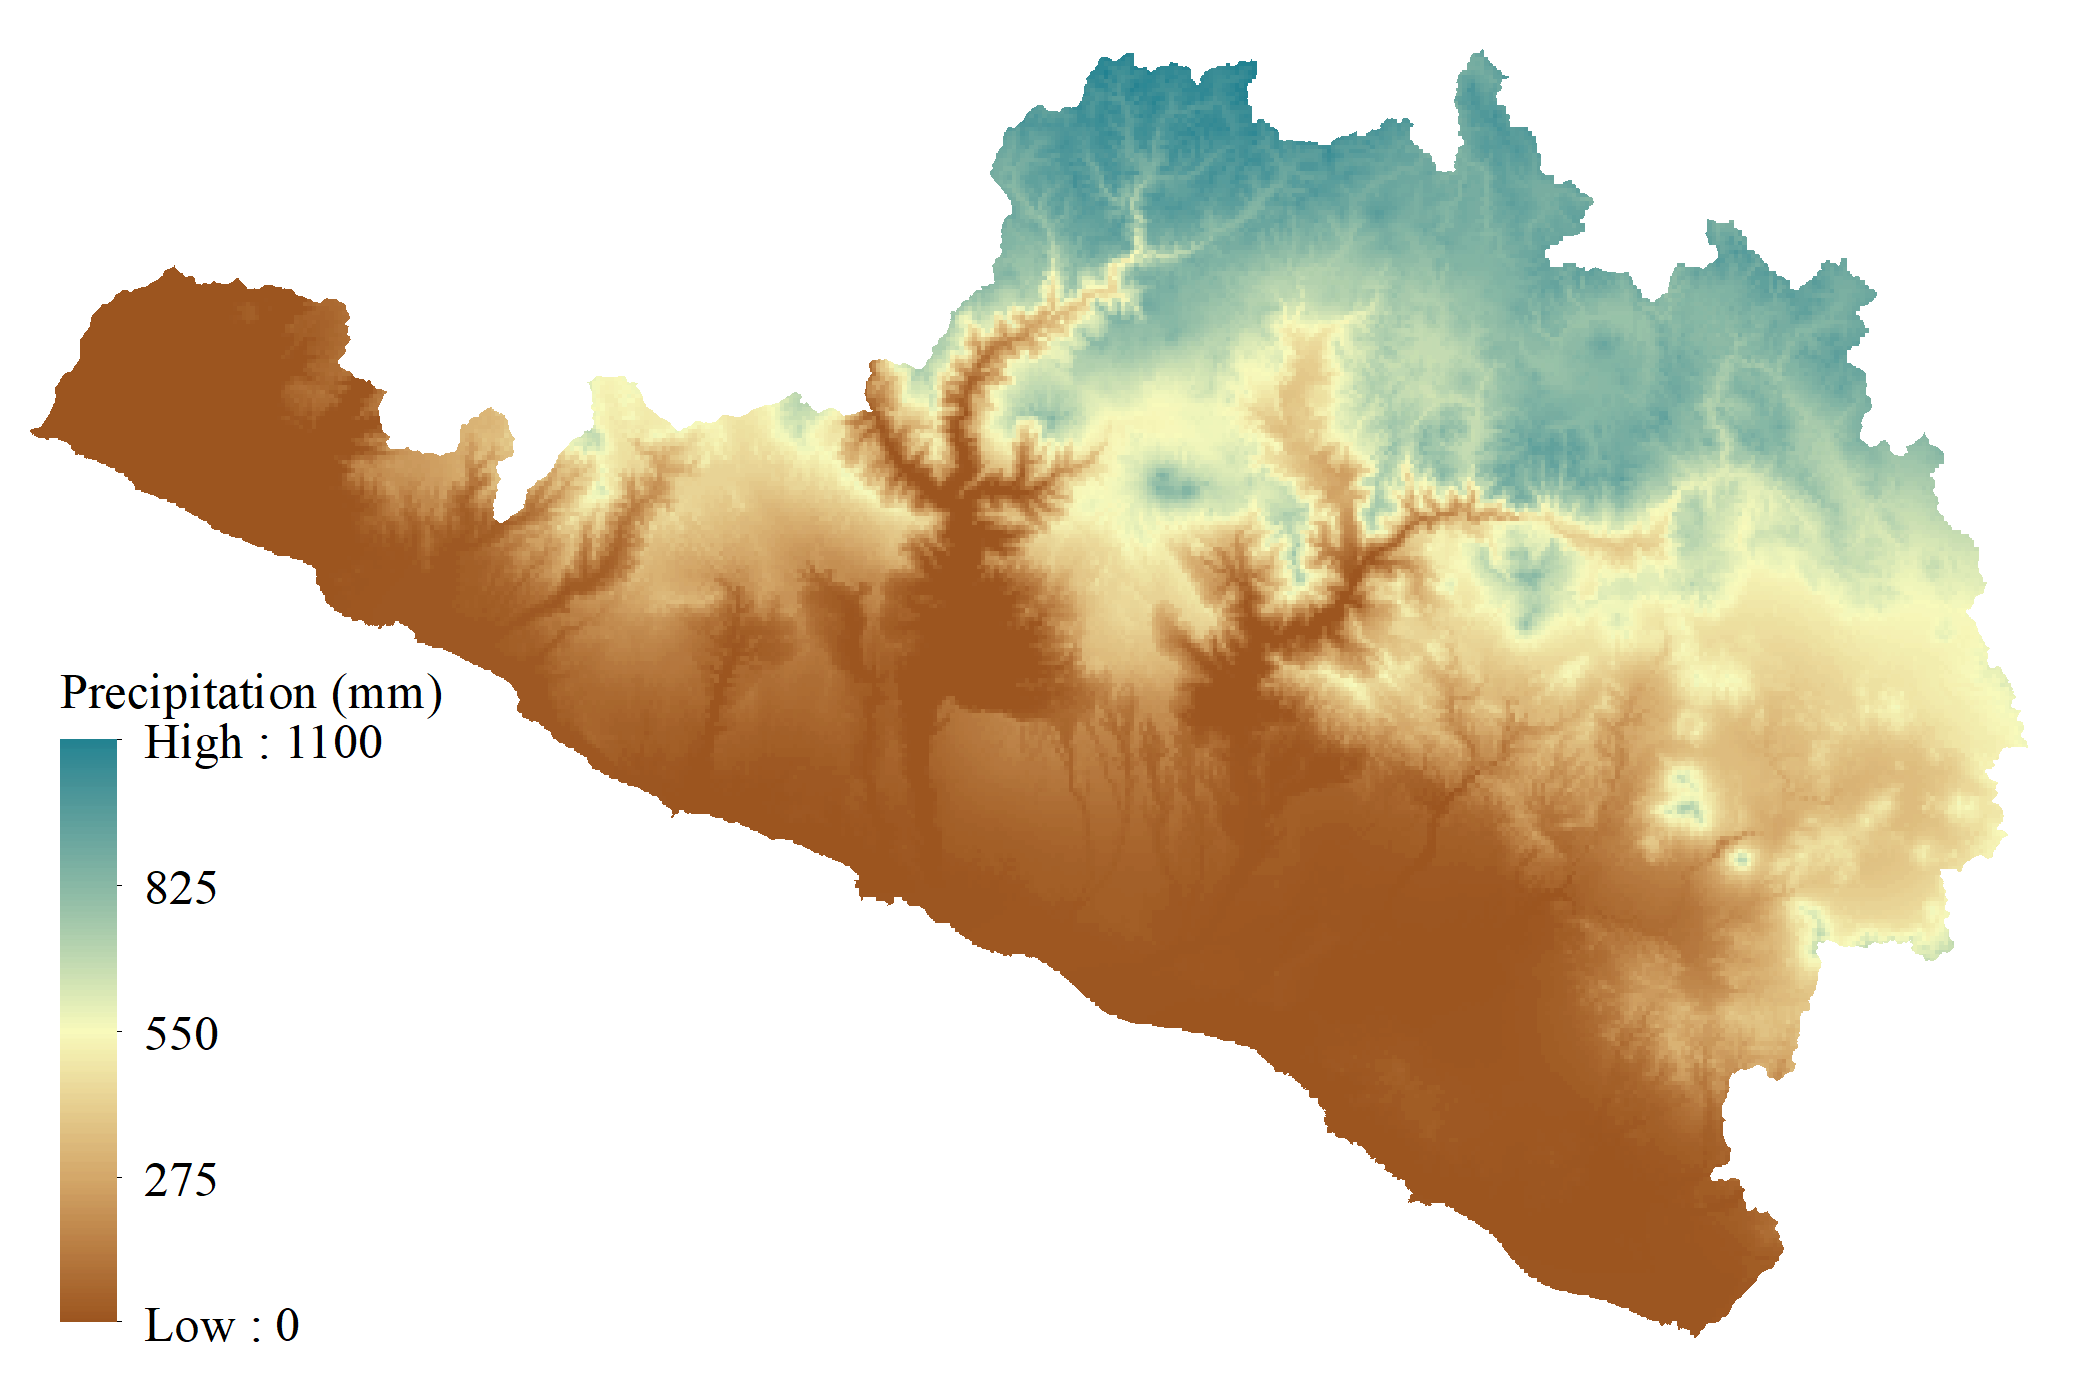
Average Annual Precipitation
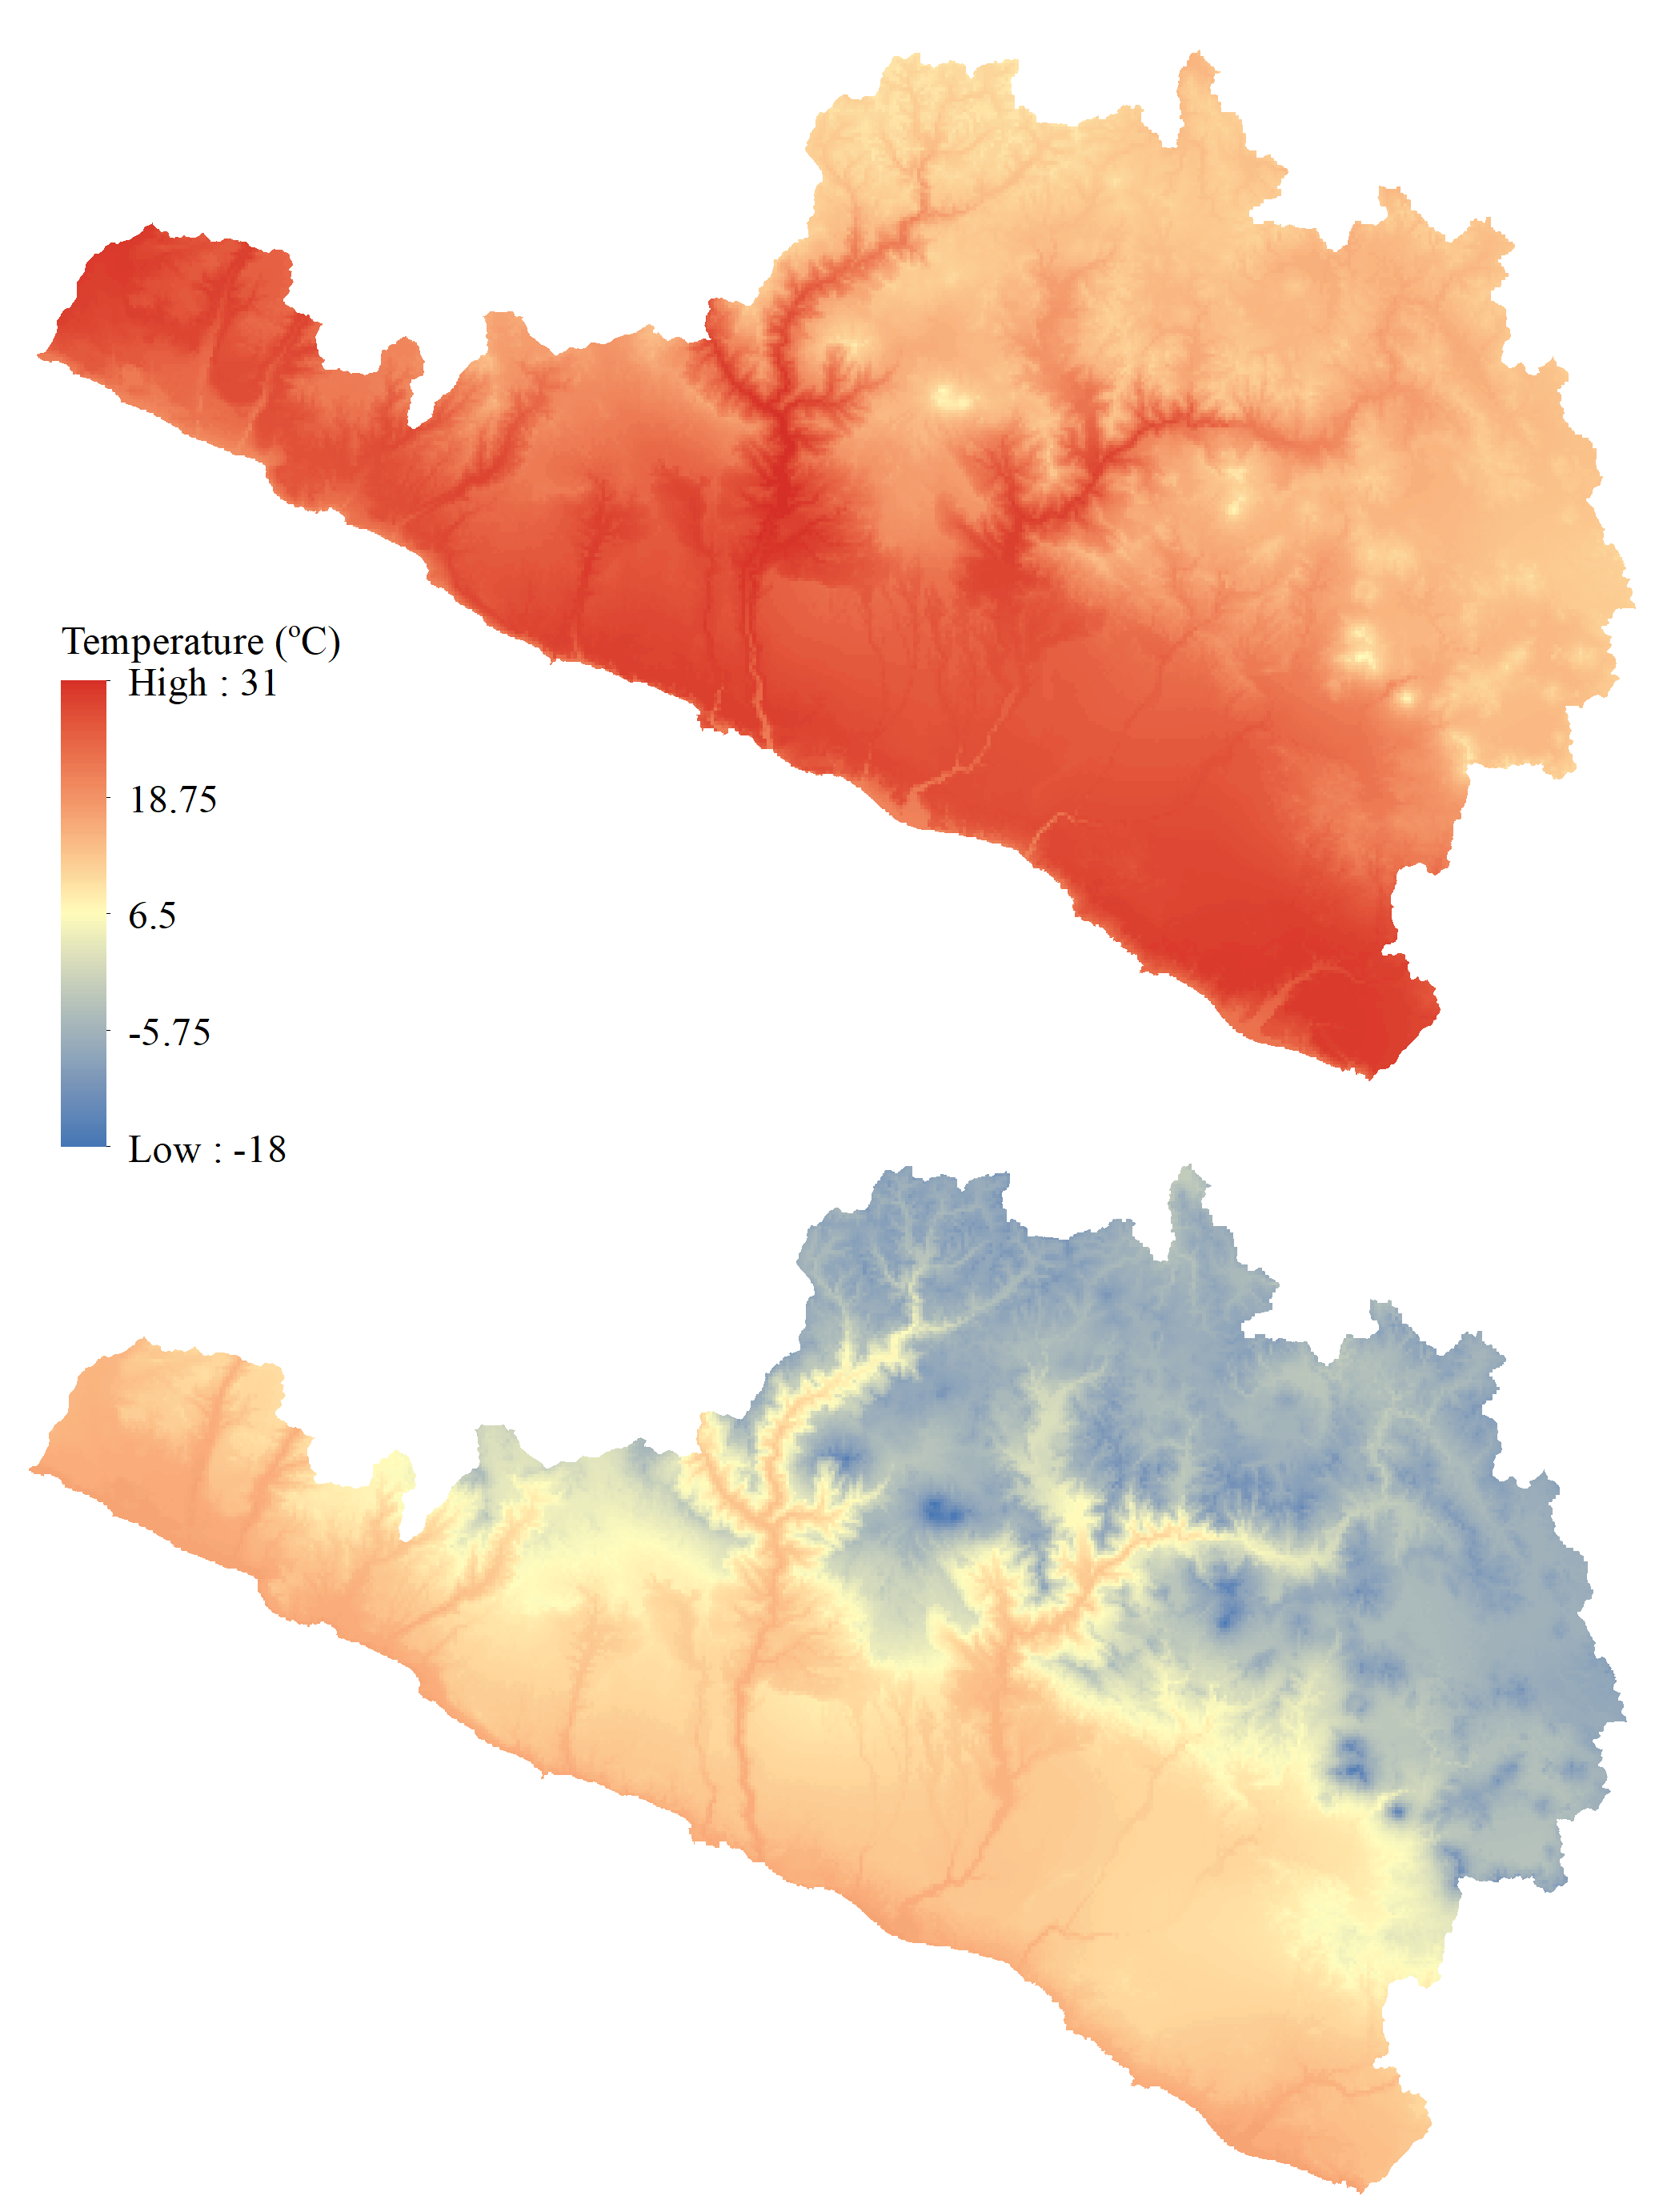
Annual Average Daily Maximum and Minimum Temperature
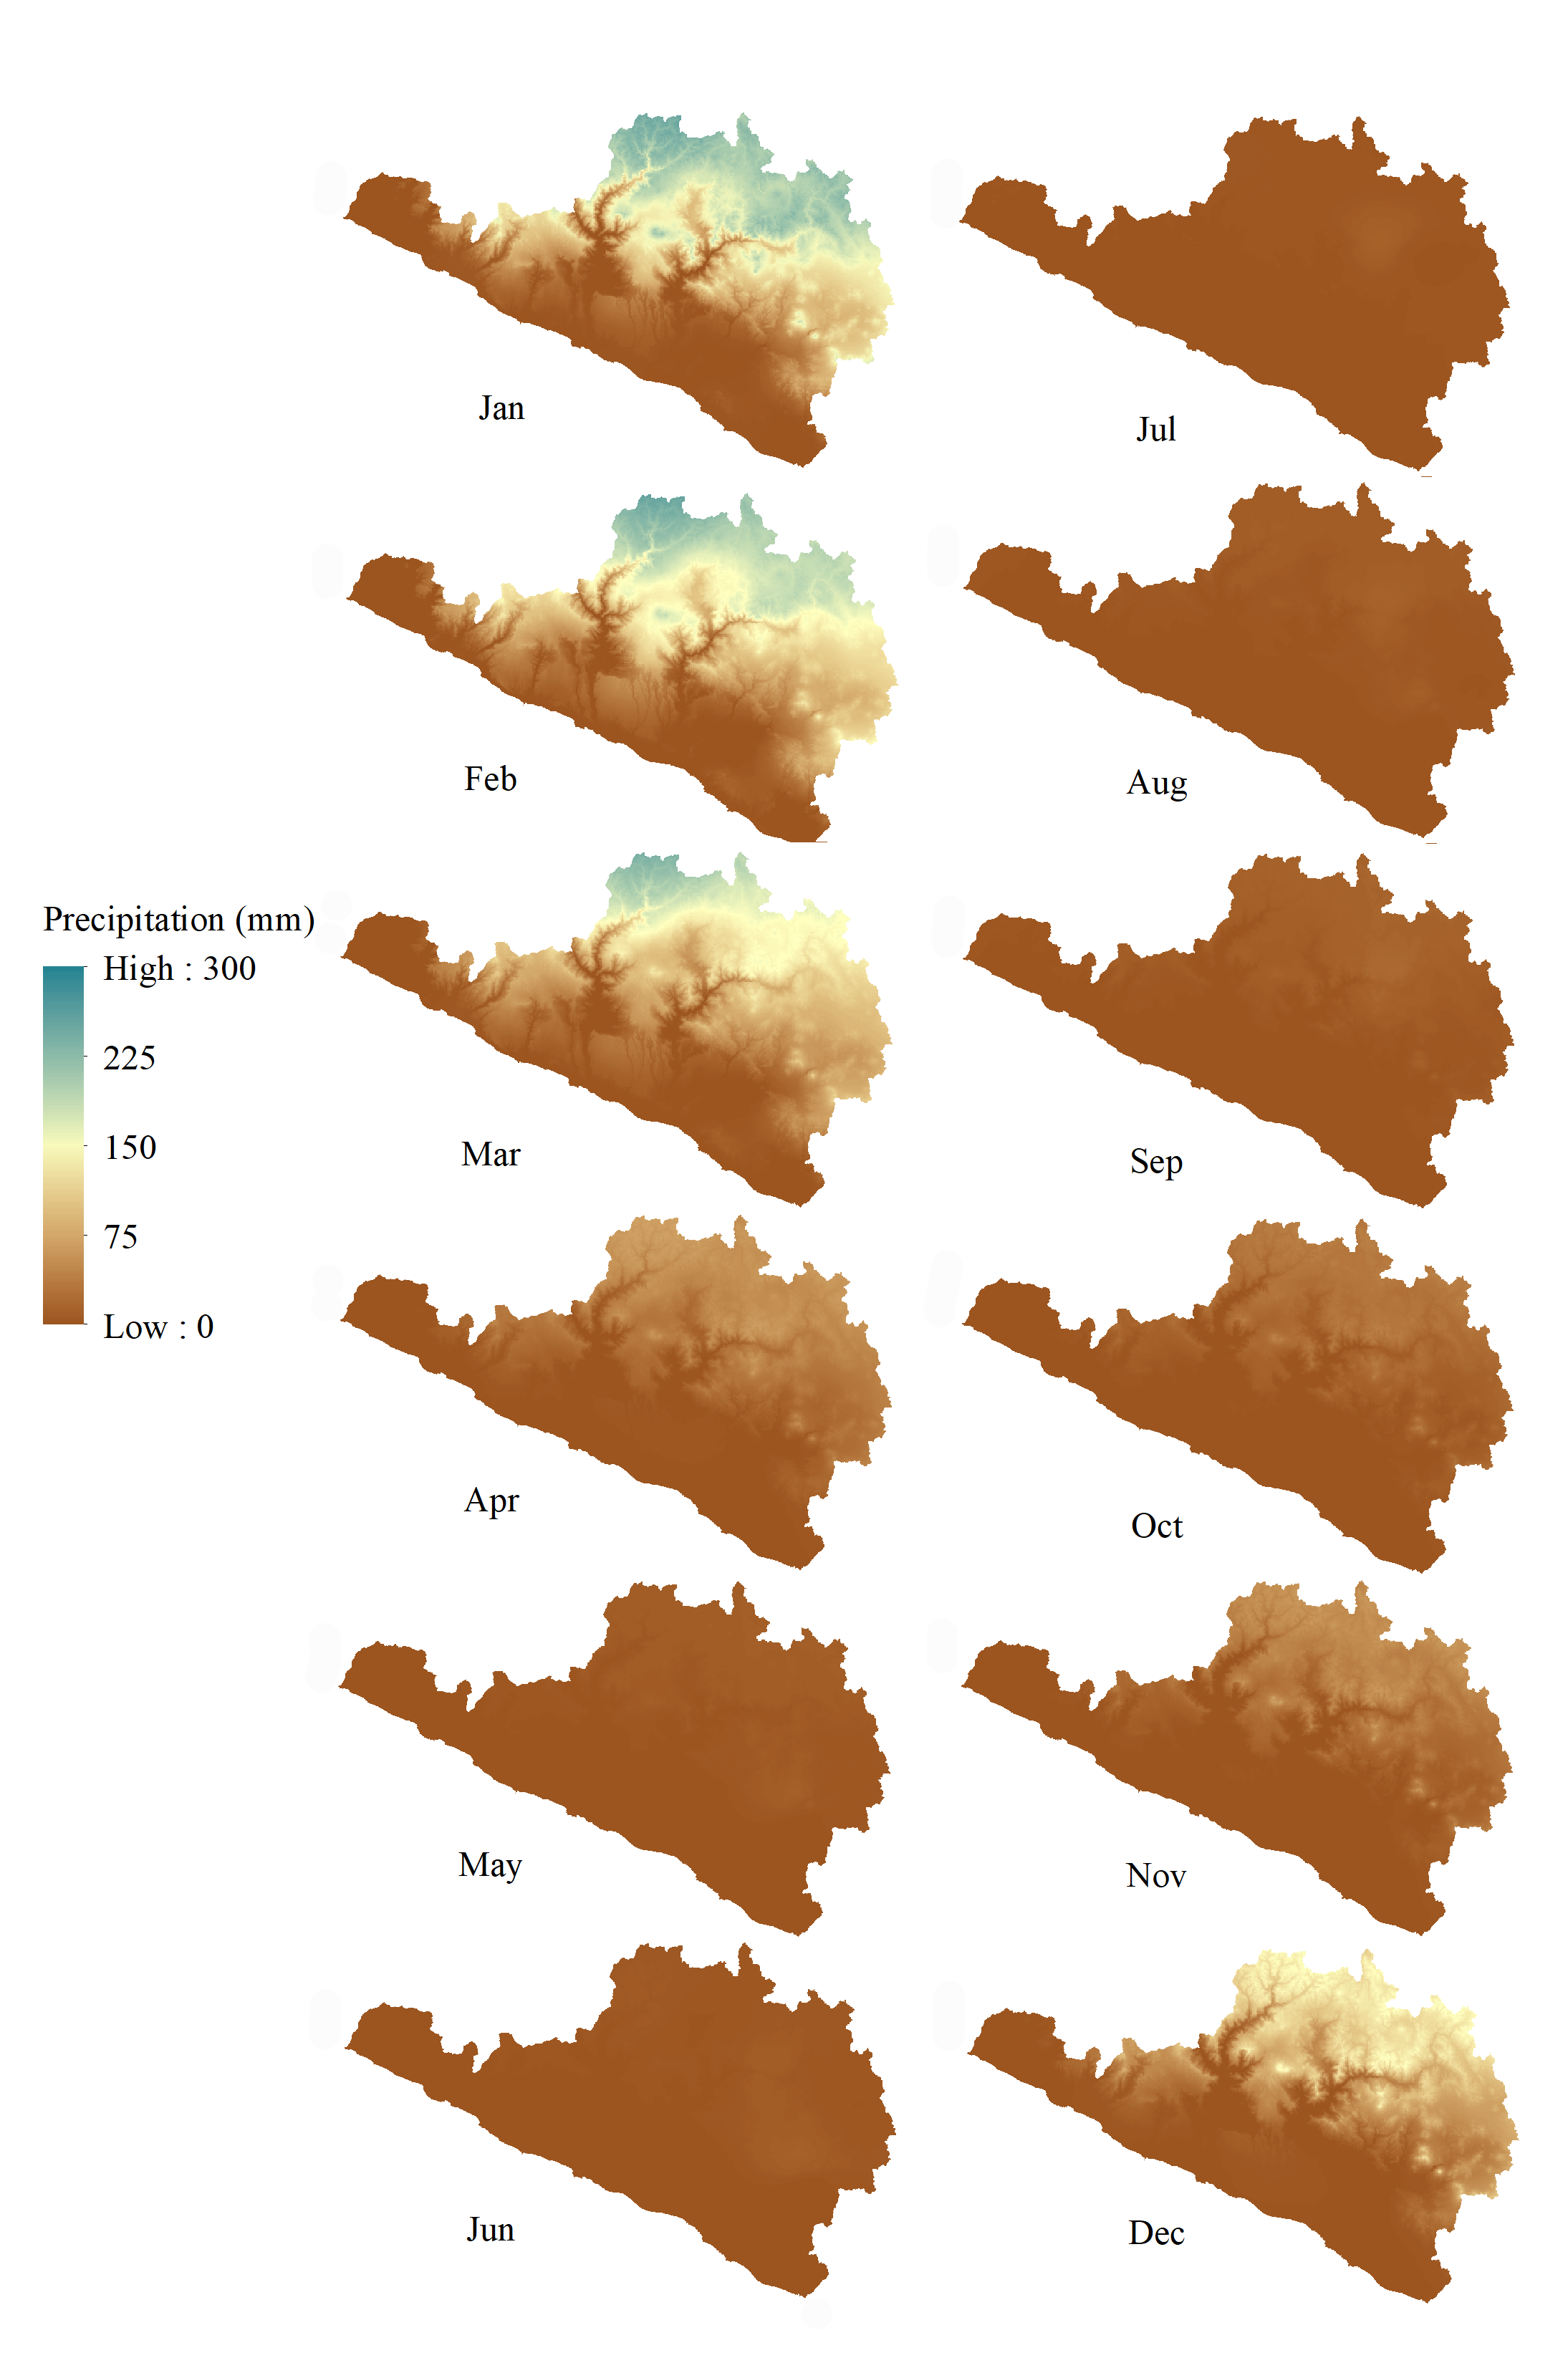
Average Monthly Precipitation
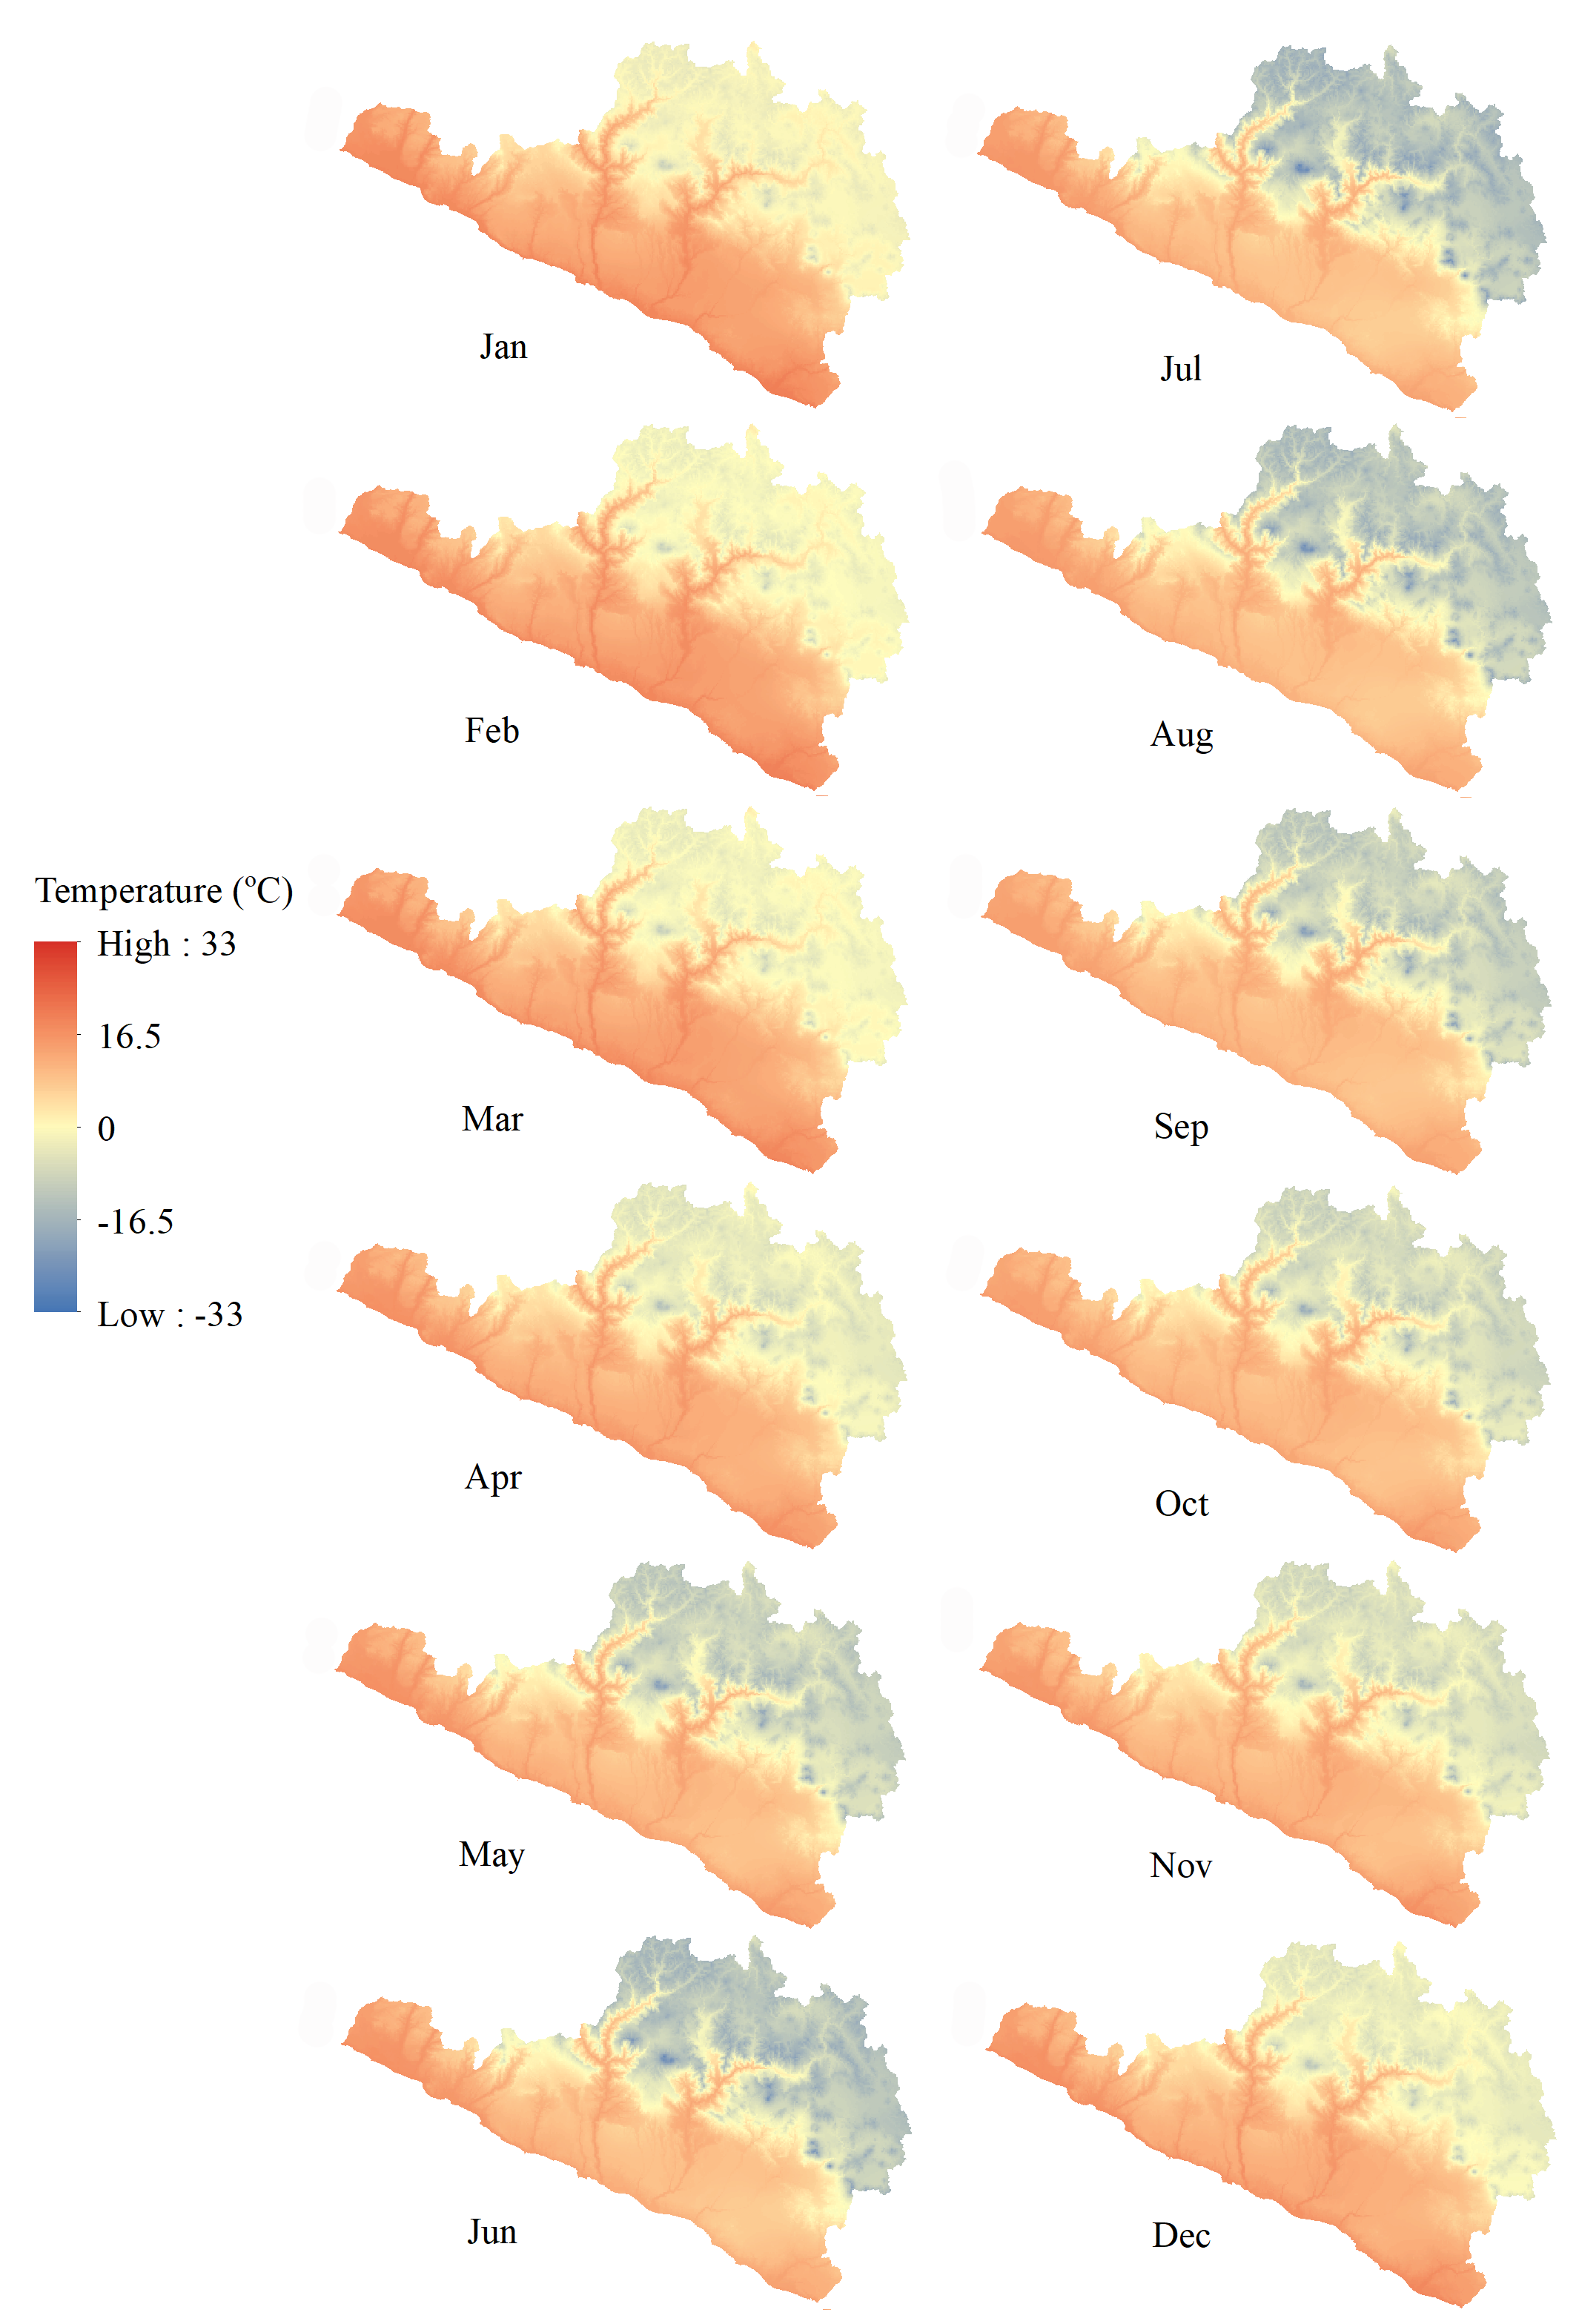
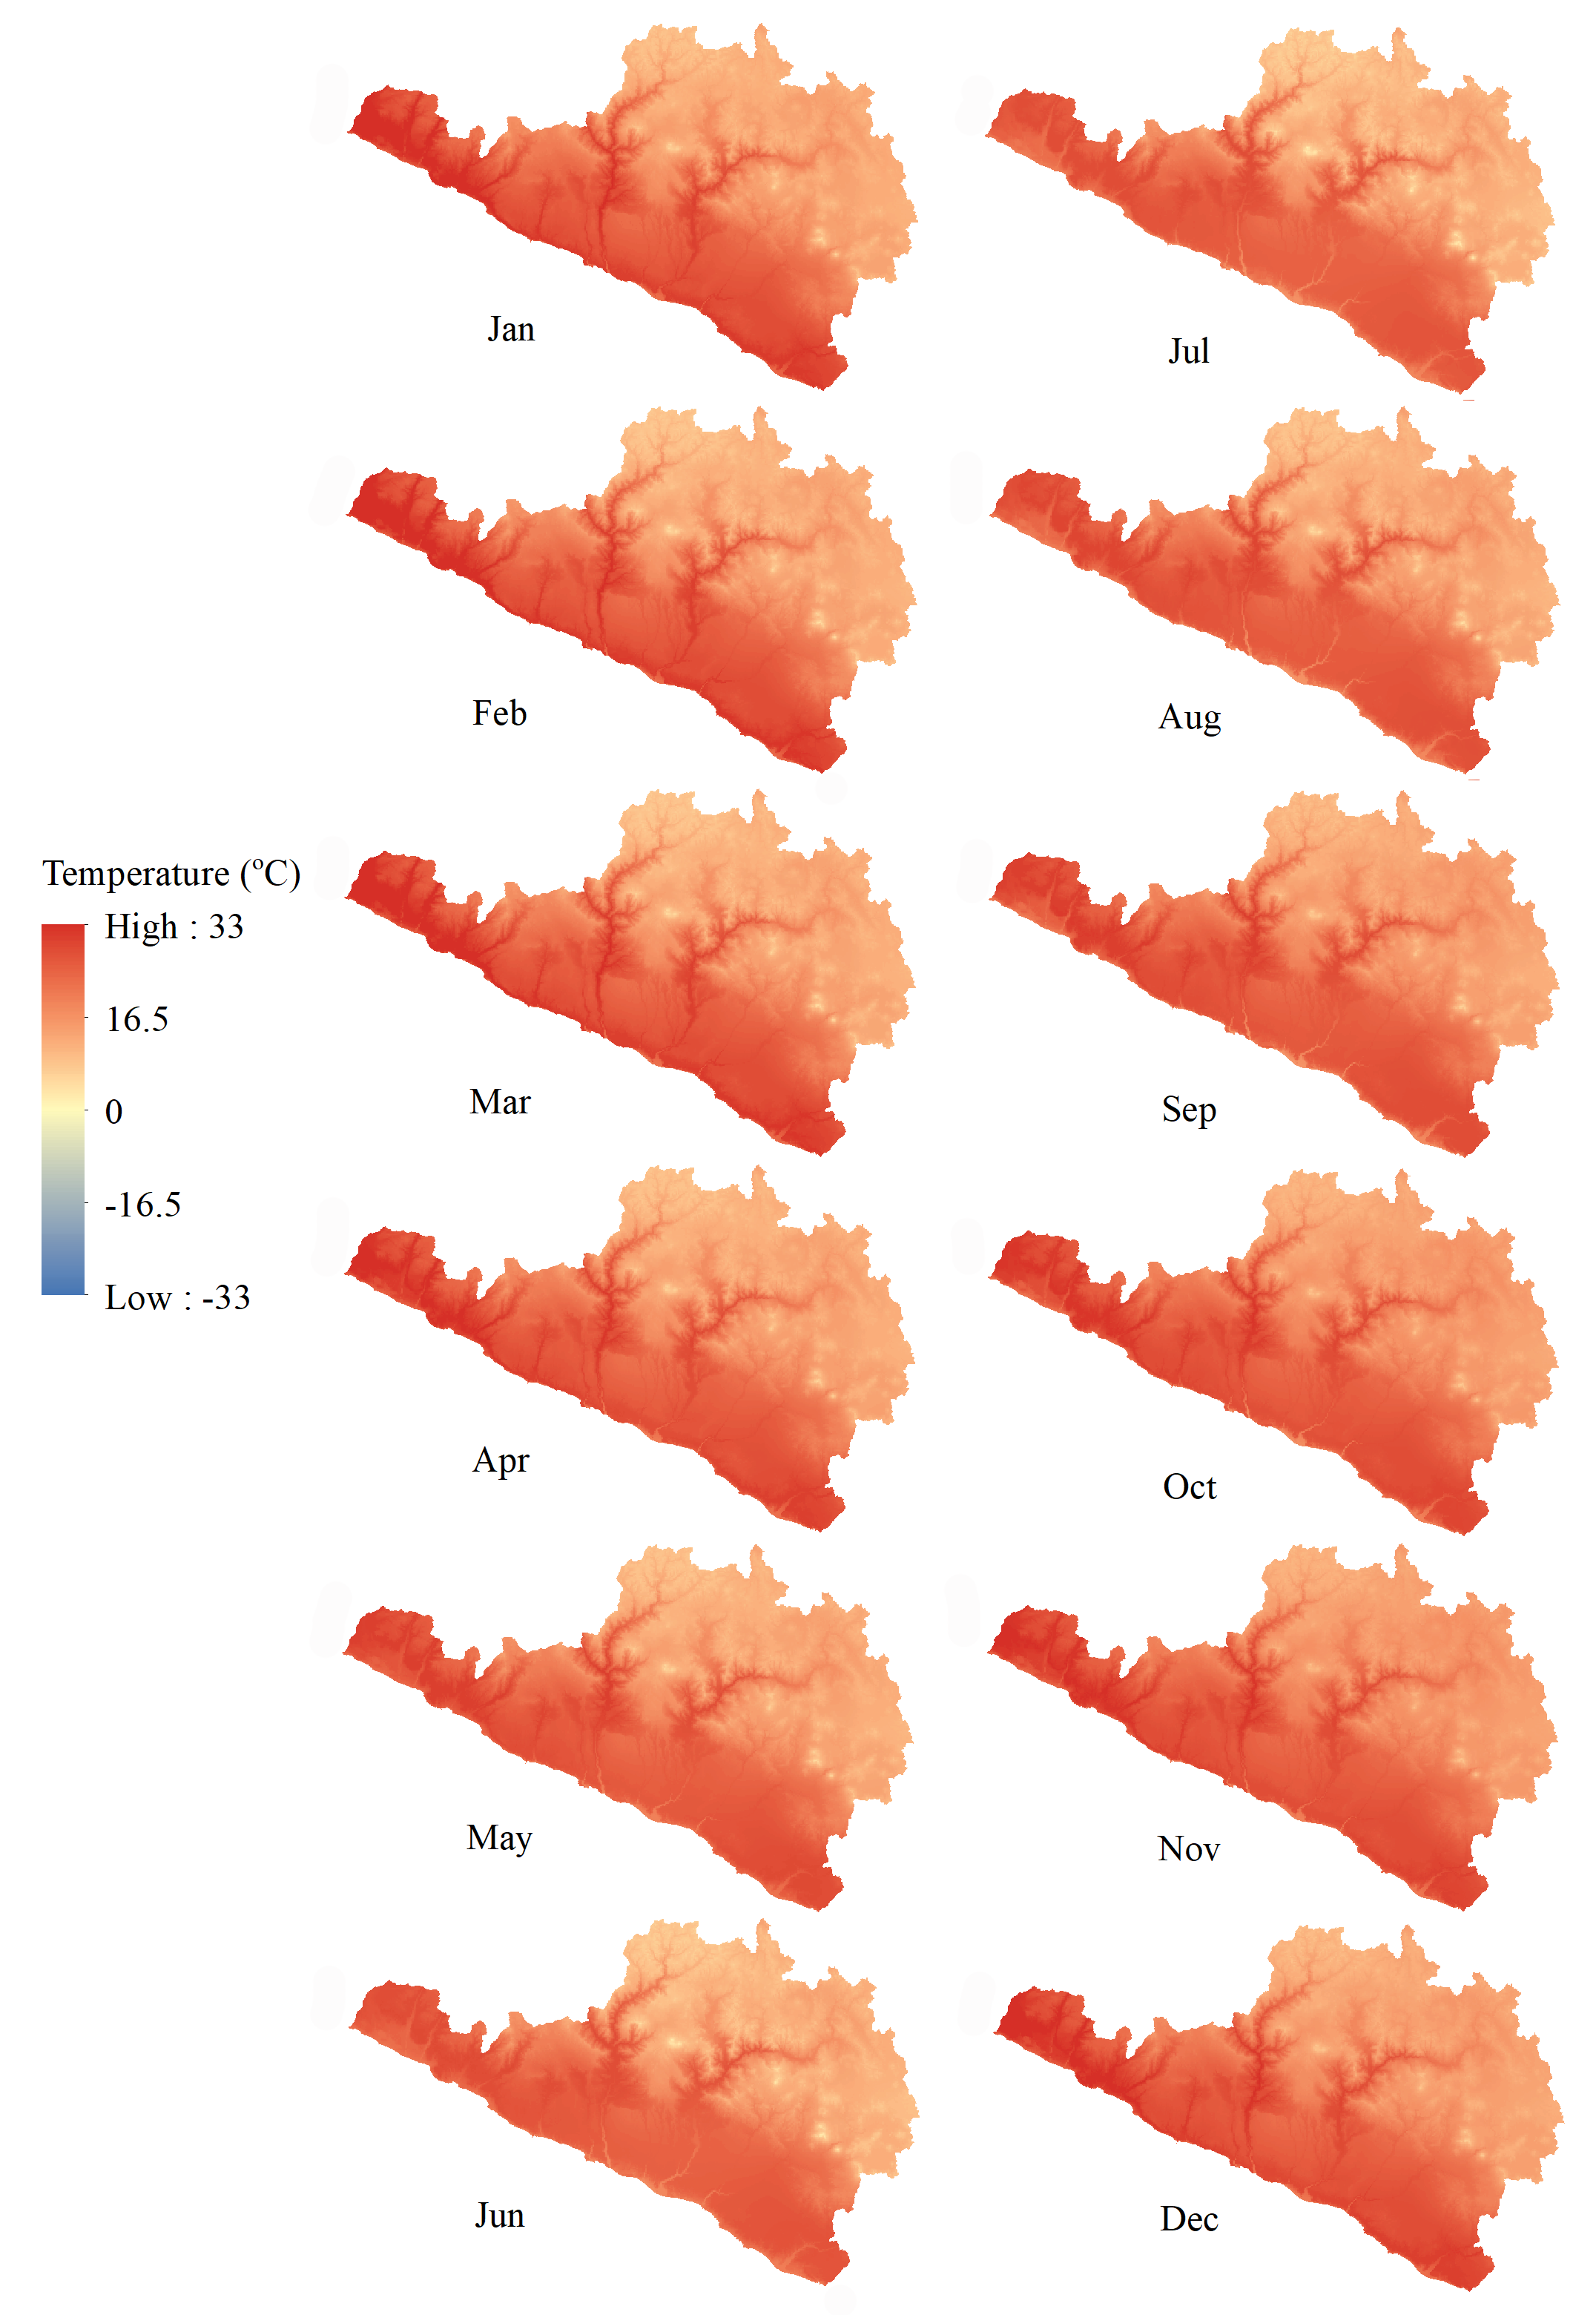
Monthly Average Daily Maximum Temperature
Monthly Average Daily Minimum Temperature